

- Tutorials
- Make dashboard more dynamic
Tutorials
Make dashboard more dynamic
The dashboards we created before are static, which means values are statically written.
A prometheus query go_gc_duration_seconds{job="node"} is a static query string, what if we want to query another job? We have to change the query string to go_gc_duration_seconds{job="prometheus"} , that’s not convenient for a lot of cases.
So, it’s time to introduce some features to make our dashboard dynamic. In this doc, we will make the dashboard more dynamic by adding variables.
Create a variable
There are two kinds of variables: dashboard variable and global variable. Let’s start from dashboard variable first.
- Visit
Hosts infodashboard and open its settings modal, selectVariablestab. - Click
New Variablebutton, you will see a modal like this:
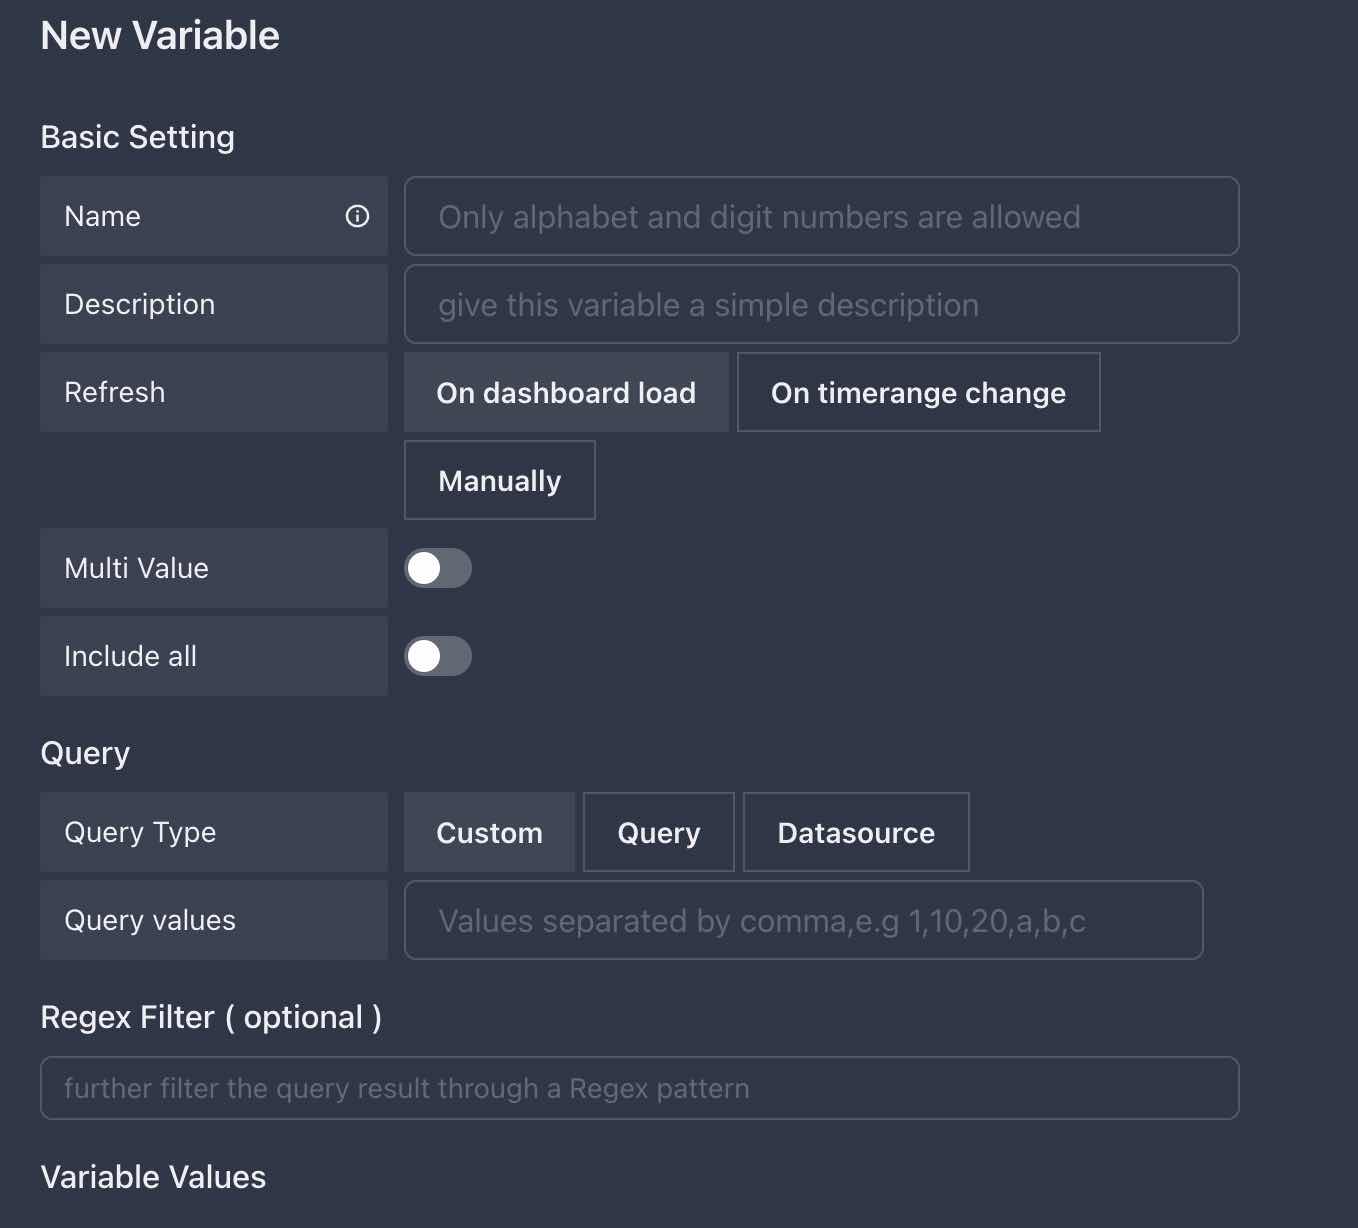
wow, it seems complex, but don’t worry, let’s start from a simple one :)
In this secion, our target is to make job dynamic, as it has two values: node and prometheus, we need to create a variable also has these two values.
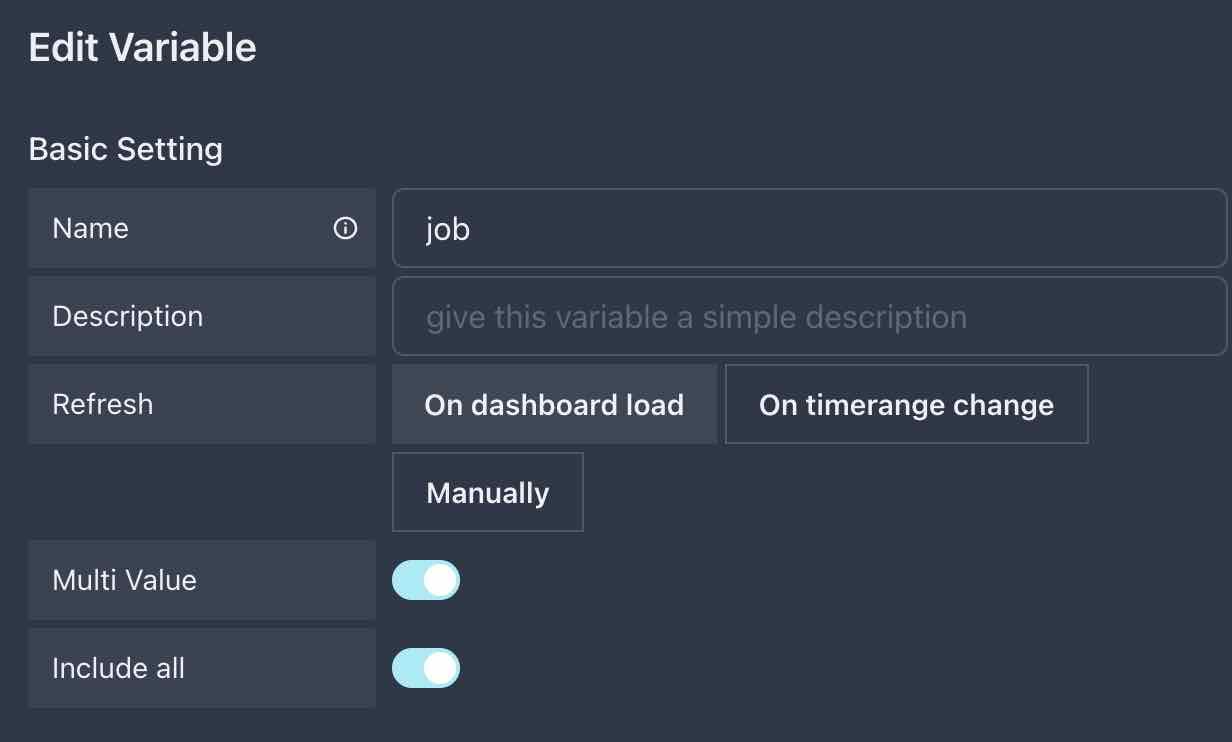
- Fill the form like this:
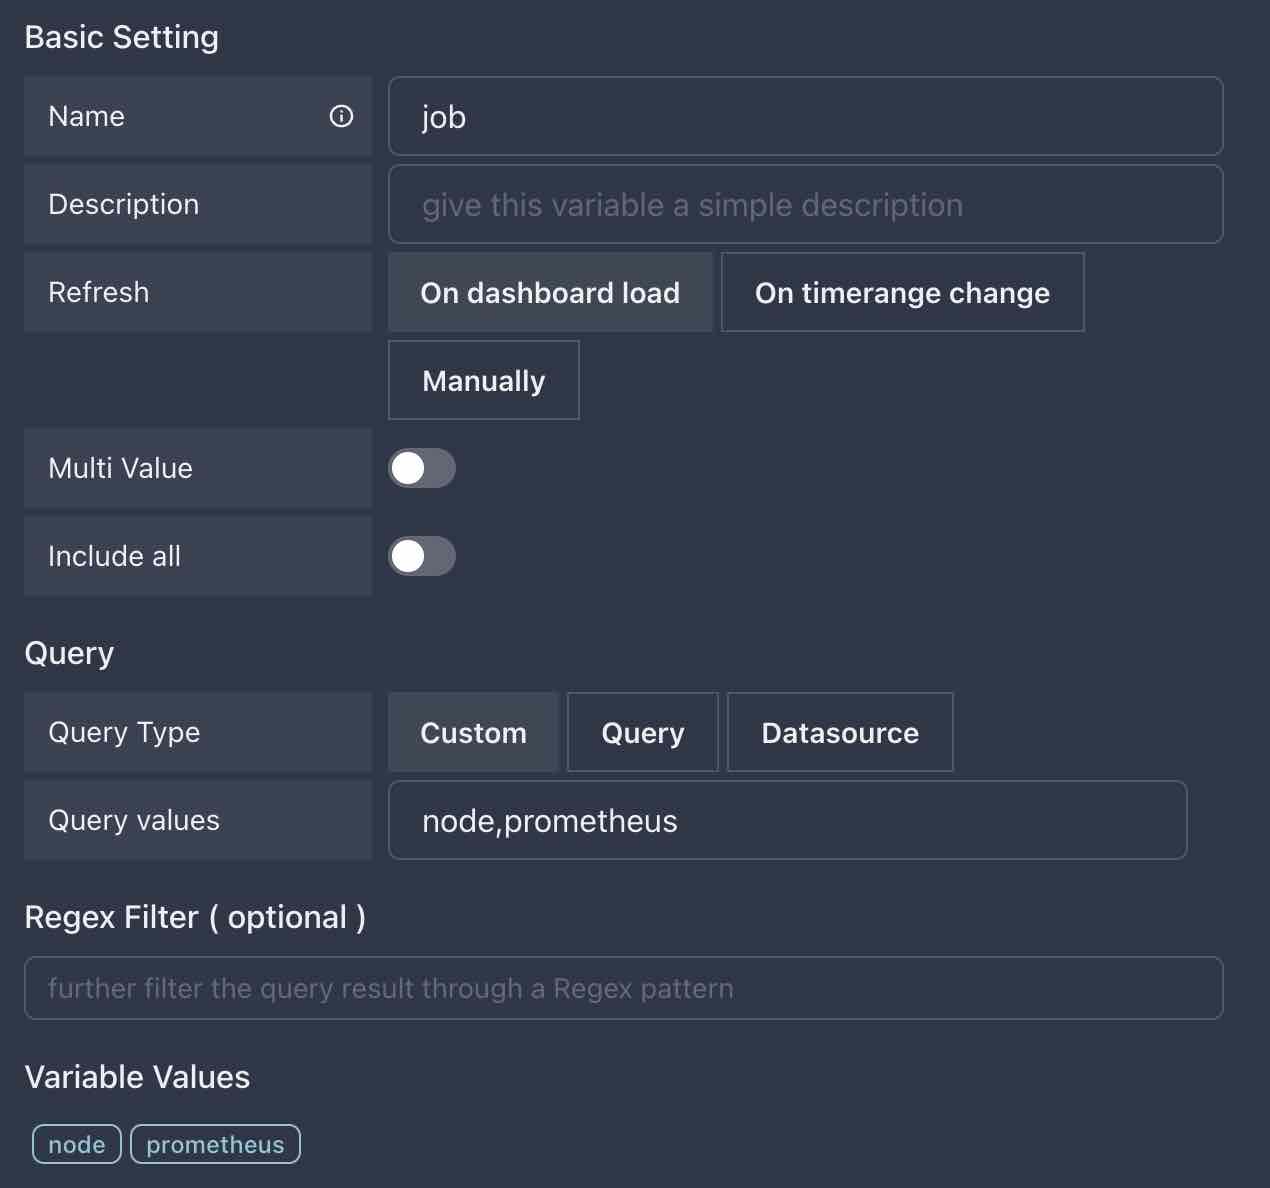
Look at he Variable Values field, this is the result that our variable query returns, so if you see values listing here, it means our variable is probably created successfully(maybe wrong values).
The job variable we are creating is a Custom type variable, its values comes from our input string, each value is separated by a comma, e.g 1,2,3 means we have three values: 1, 2, 3.
- Click
Submitbutton, you will see a new variable namedjobin theVariablestab
Don’t forget to save dashboard ! Everthing you changed in the dashboard will not be saved.
Now close the setting modal, you will see a new dropdown list appears in the top left corner of the dashboard, it’s our job variable.

Use variable
In this section, we will use the variable we created in previous section.
Use variable in query
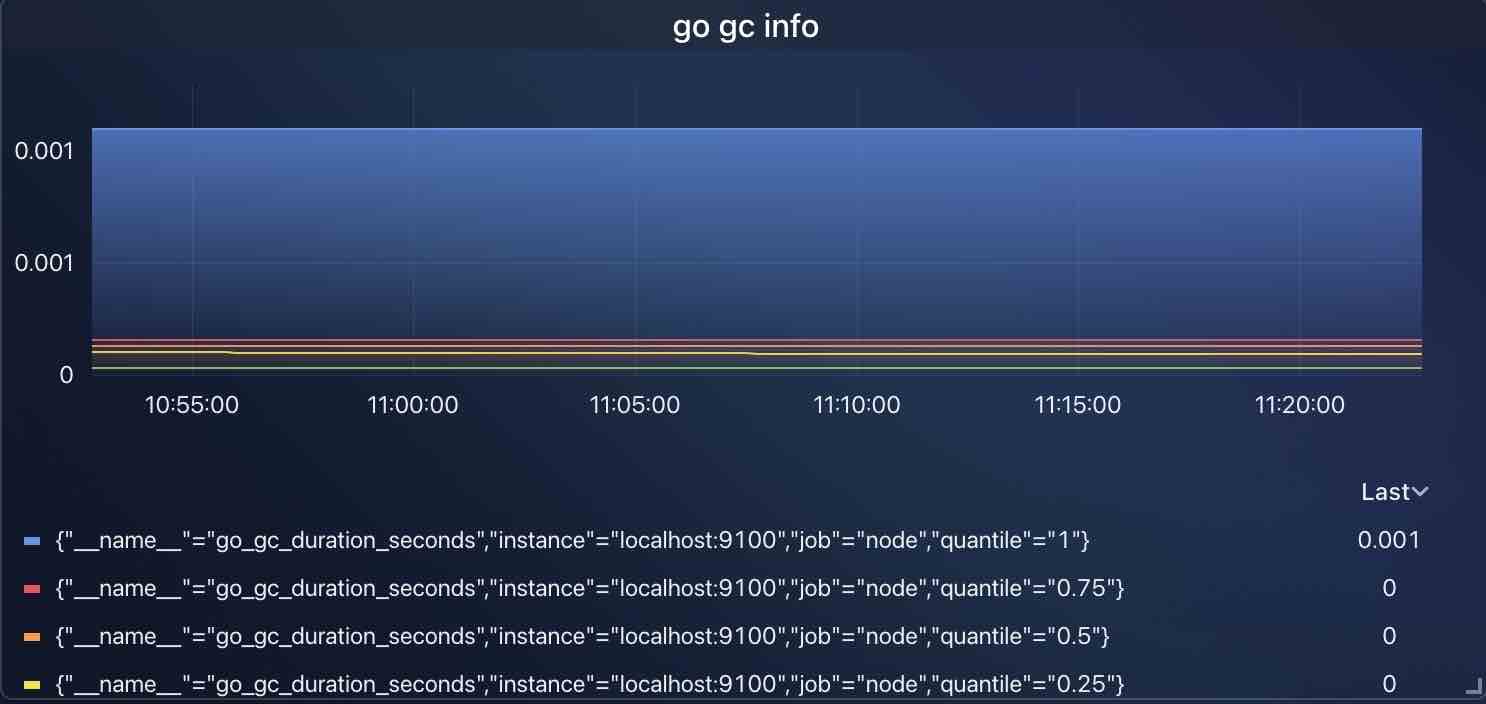
Now open the editor of panel go gc info, change the query string to go_gc_duration_seconds{job="${job}"}, then click Apply button.
Because job variable is automatically set to node, so our go gc info panel will show the data of node job, the same as go_gc_duration_seconds{job="node"}.
Try to change the value of job variable to prometheus, and see what will happen to the chart data.
Variable format
${job} in the query string is a variable format, it will be replaced by the value of variable job when the query is executed. You can use as many as variables in the query string, e.g go_gc_duration_seconds{job="${job}", instance="${instance}"}.
Use variable in panel title
Variable can be used in many places, usually there will be a Support variables tips in the input box.
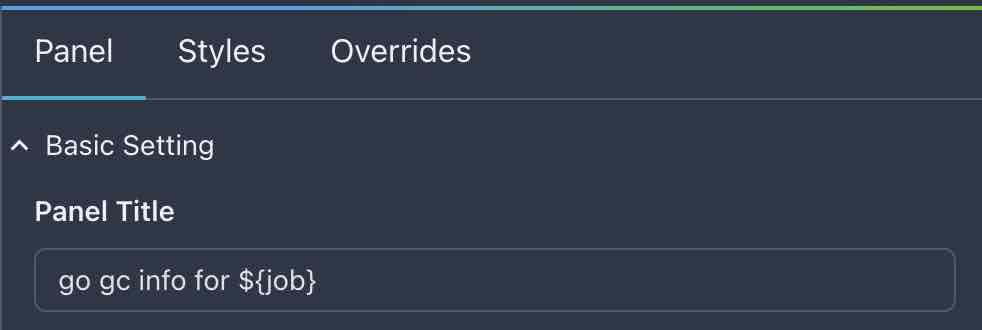
Because our panel is dependent on variable job, so we can add it to panel title so that we can know which job we are currently viewing.
Modify the panel title to go gc info - ${job}:
Multi value and All
What if we want show use multiple variable values in query? Maybe you can create multiple variables, but it’s not a good idea.
The better way is to enalbe Multi Value or Include all options for variable, thus we can select multiple values from variable dropdown list.
Modify job variable as below:
Back to dashboard page, you will see the job variable dropdown switches to multiple selection mode, and there is a new option __all__ in the dropdown.
Try to select all or select both node and prometheus, you will see…nothing?
Yep, you will see nothing in the chart, because the query string is go_gc_duration_seconds{job="${job}"}, it’s not a valid query string when job variable has multiple values.
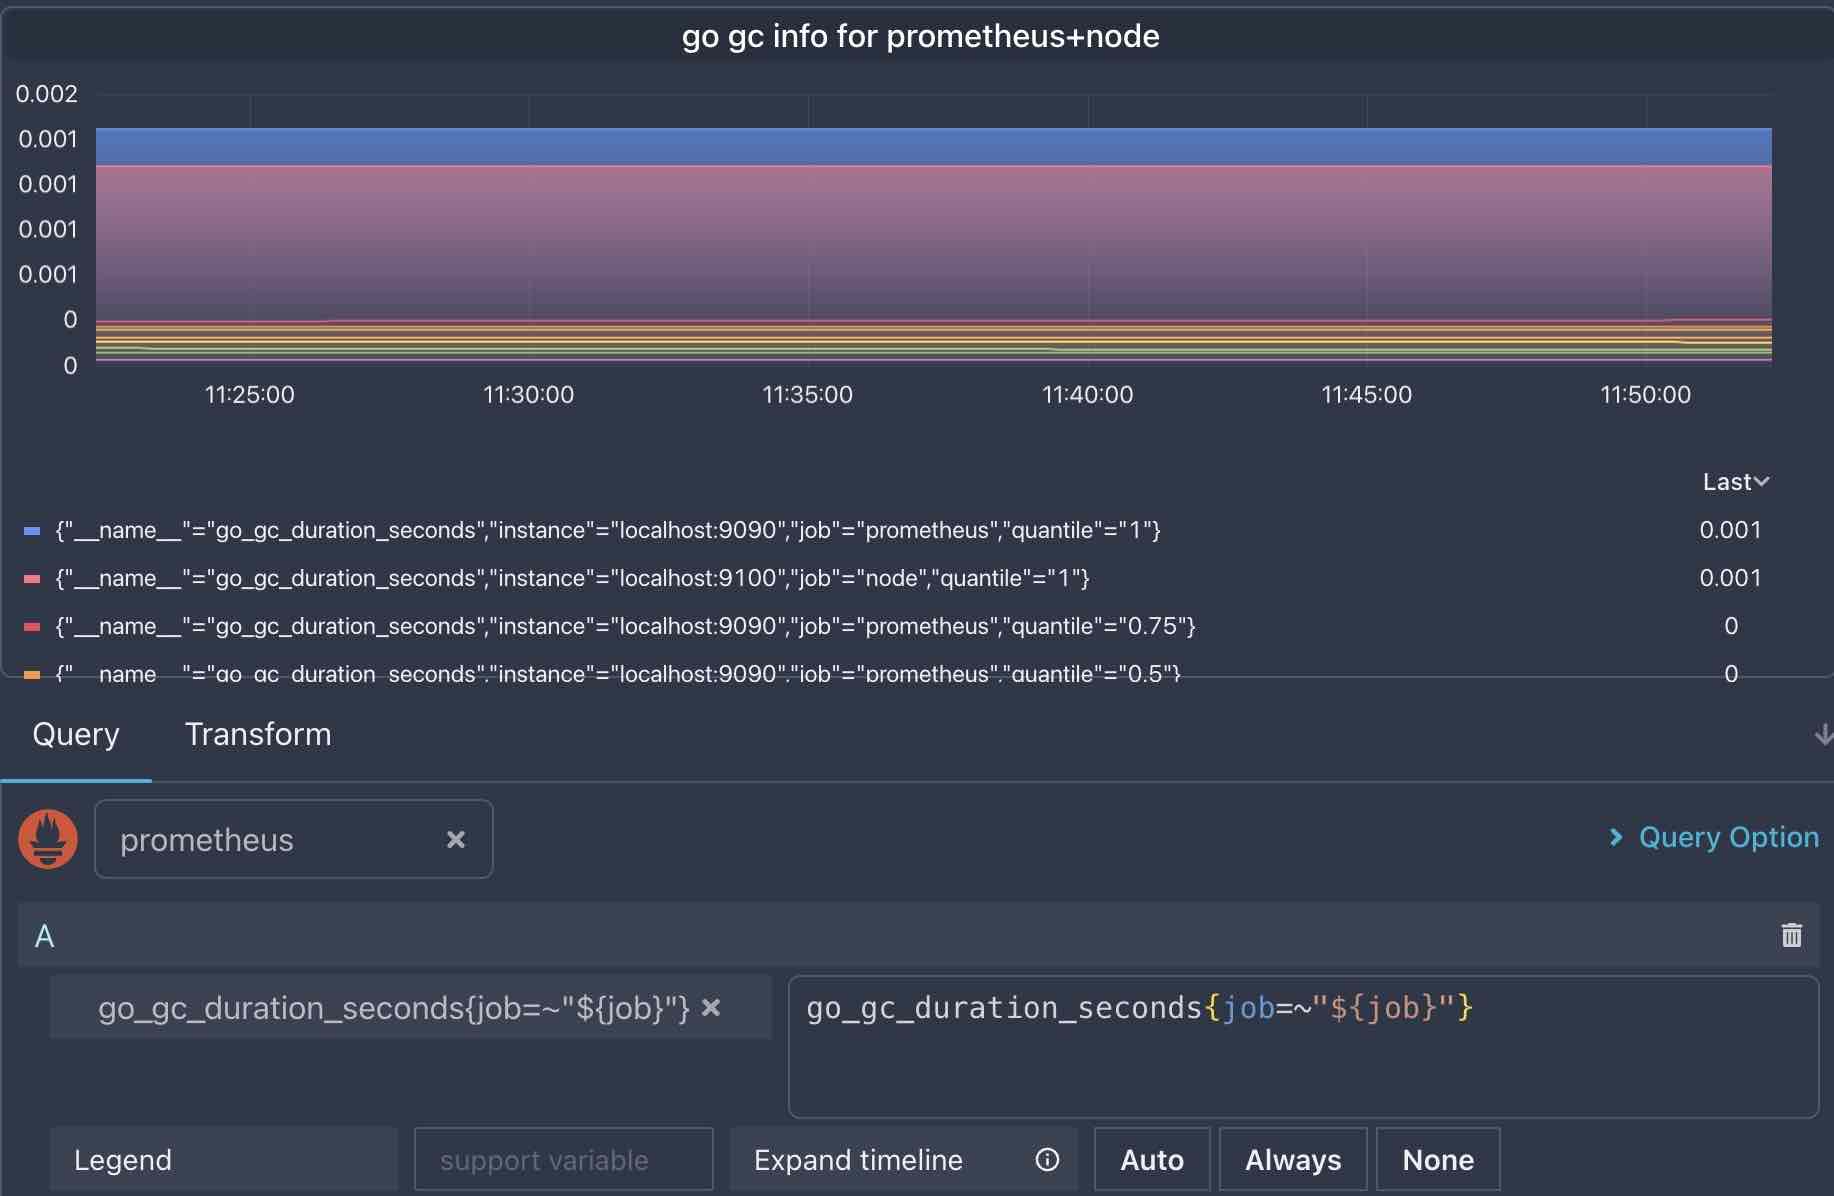
According to the Prometheus document, we should modify our query string to go_gc_duration_seconds{job=~"${job}"}.
Modify the query string to see the result as below image:
Query from datasource
In previous section, we are using variable query from a manually inputing string, what if we want to get some values from external services, like Prometheus datasource?
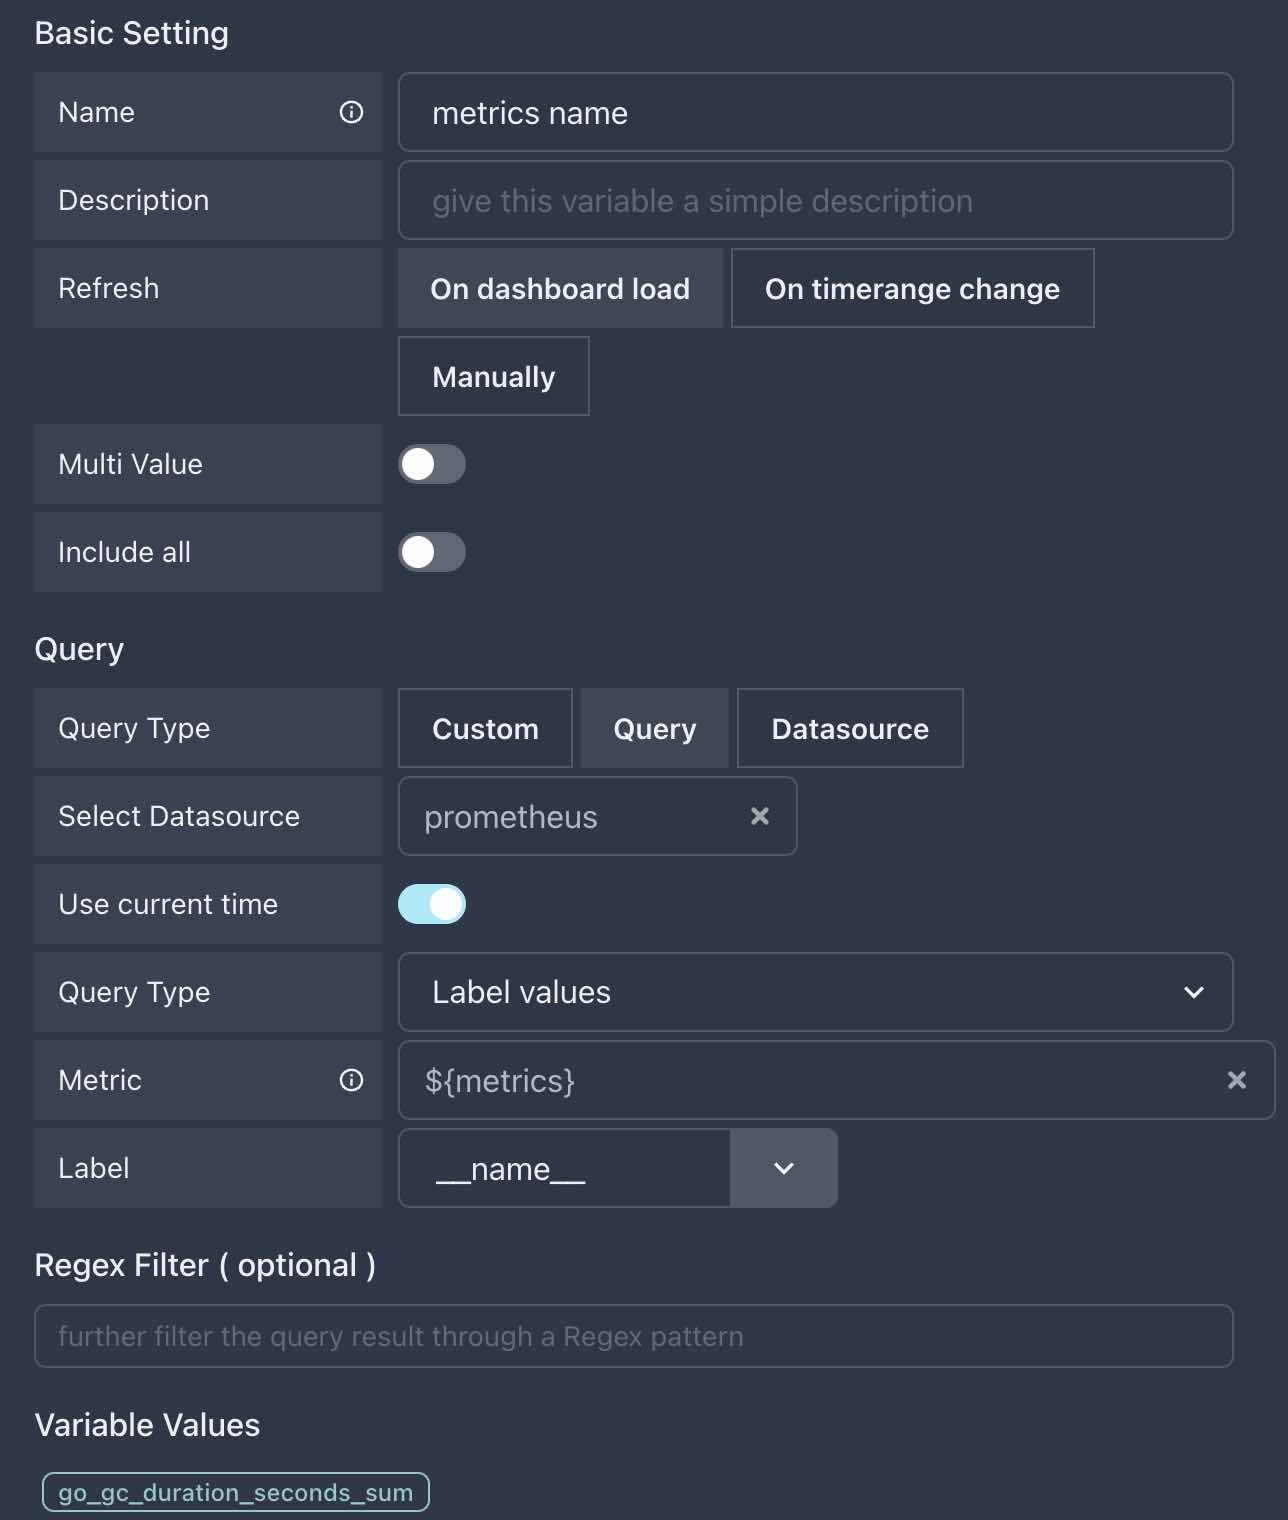
Let’s create a new variable named instance to query all instance names from Prometheus.
- Open the settings modal of
Hosts infodashboard, selectVariablestab, clickNew Variablebutton. - Fill the form like this:
We do several things here:
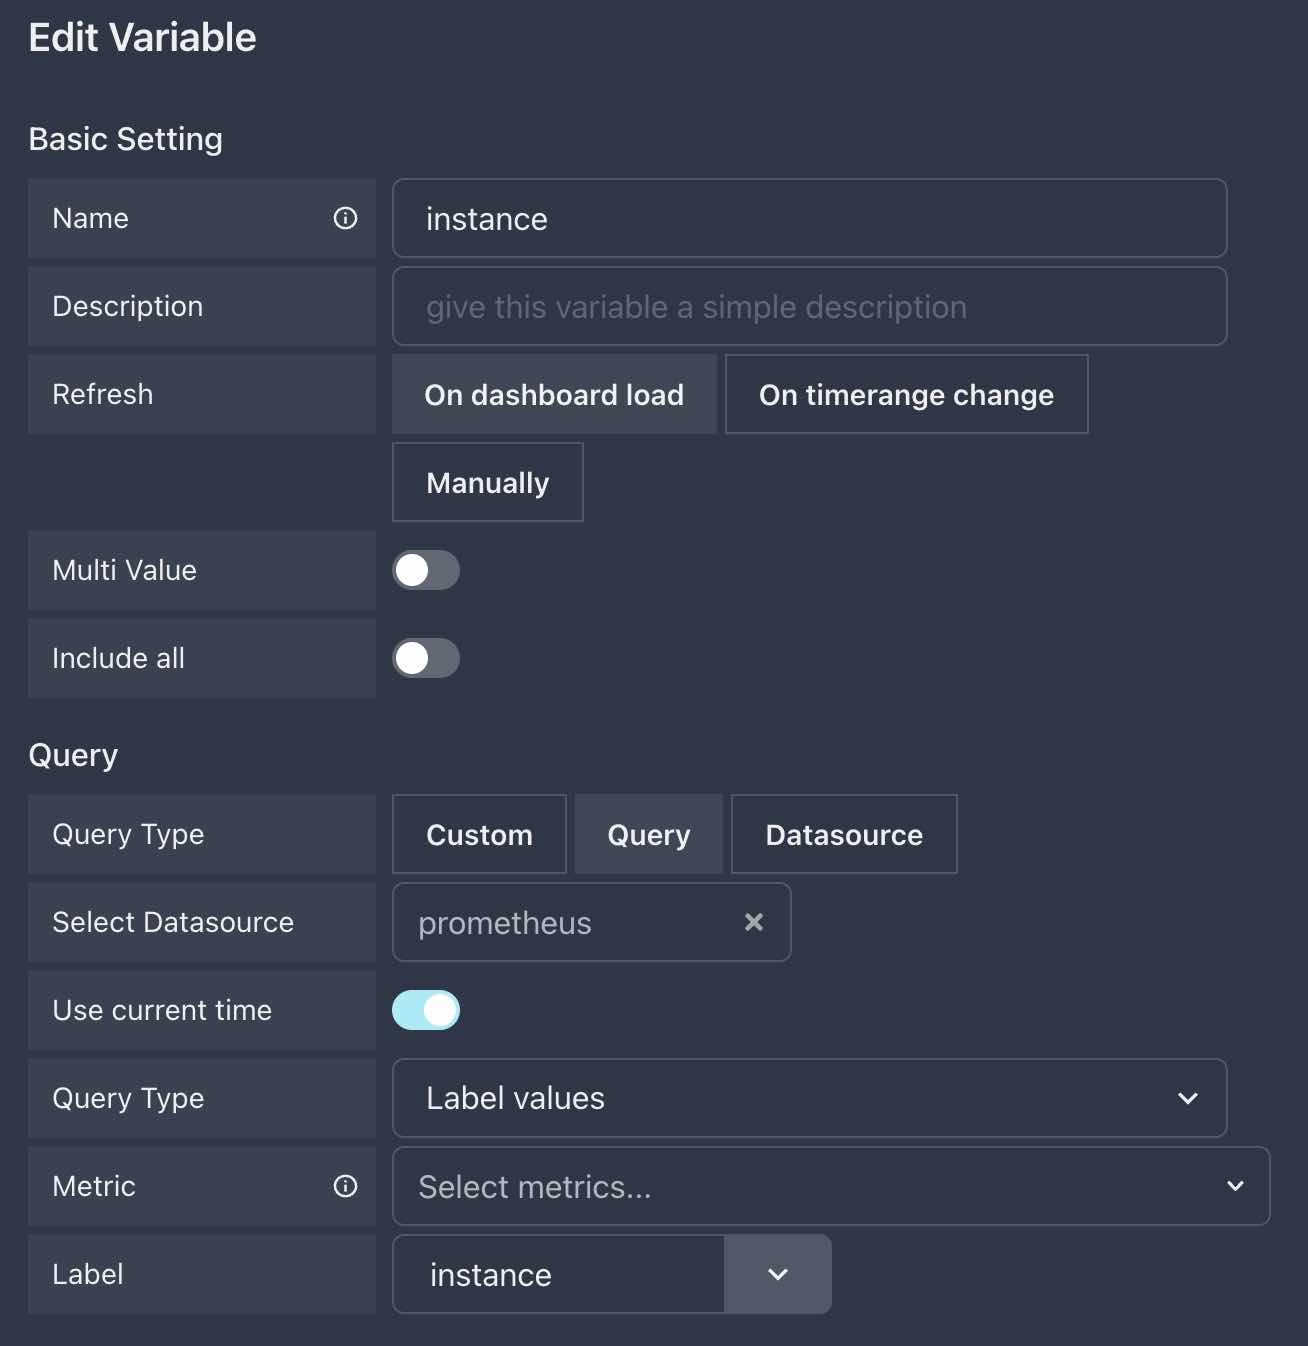
- Set
Query Typefield toQuery, it means query from configured datasources. - Select datasource
Prometheus - Set
Use current timetoOn, it means the query will be executed within the current time range being selected, otherwise if you set it toOff, the query will bring no timerange, maybe you will get values from months even years ago. - Because we want get the values of label
instance, so selectLabel valuesforQuery typefield. - If
Metricfield is left empty, the query will return all values of all metrics forinstancelabel. Therefore we can specify a metric name here, such as go_gc_duration_seconds. However, for demonstration purpose, we will leave this field empty. - Set
Labelfield toinstance
Now let’s modify the query string of go gc info panel to go_gc_duration_seconds{job=~"${job}", instance=~"${instance}"}`, and see what will happen.
Try to change
jobvariable from using Custom query to datasource query
Make datasource dynamic
Currently, we select datasource directly in panel editor, what if we have multiple datasources in different data center and we want to select datasource dynamically?
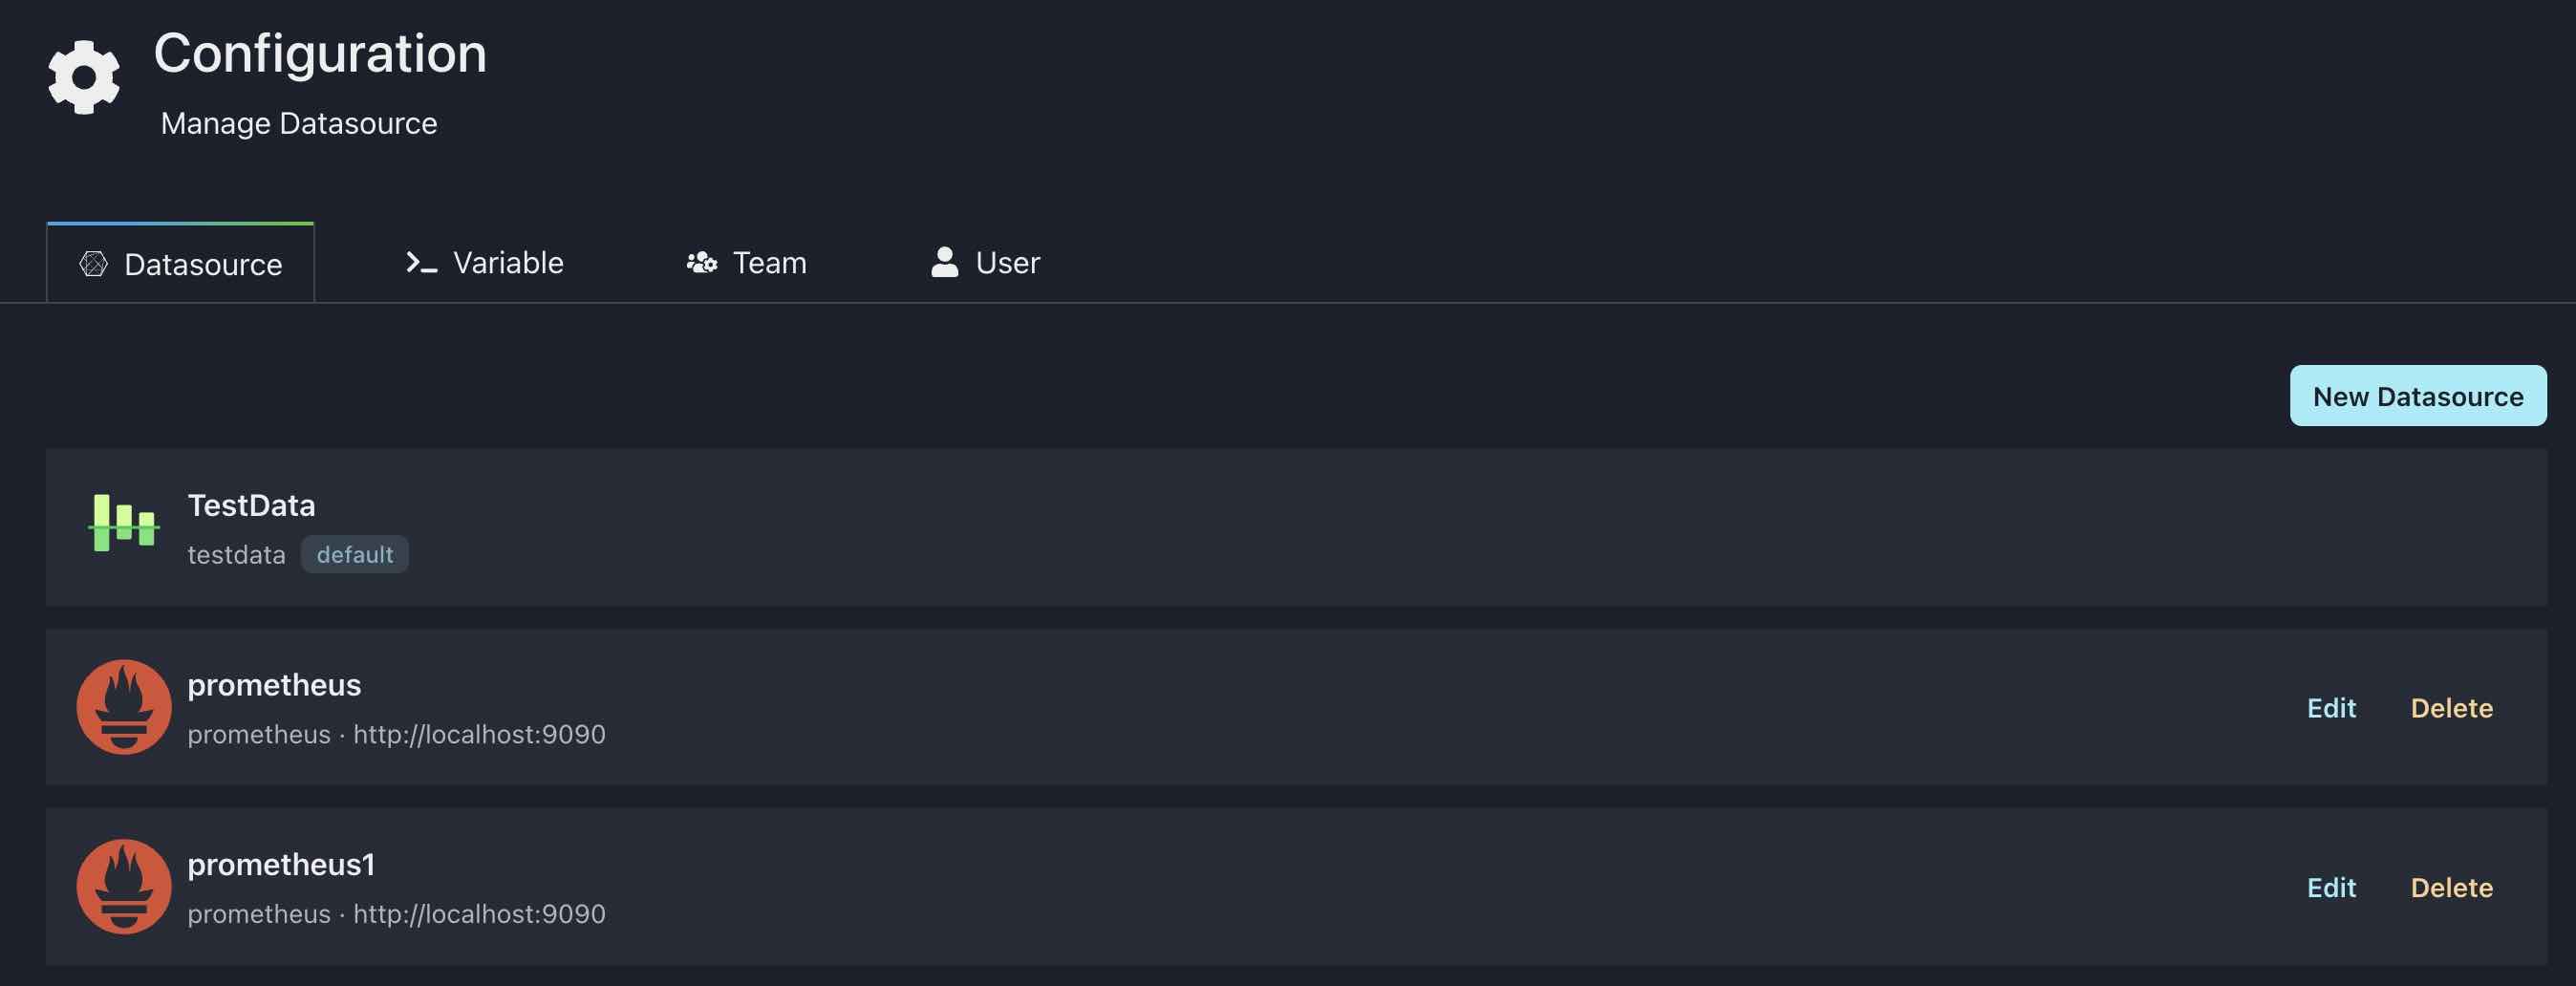
Before we start, let’s create a new datasource named prometheus1 first:
Then visit Hosts info dashboard, and open its variable editor, create a new variable named datasource:
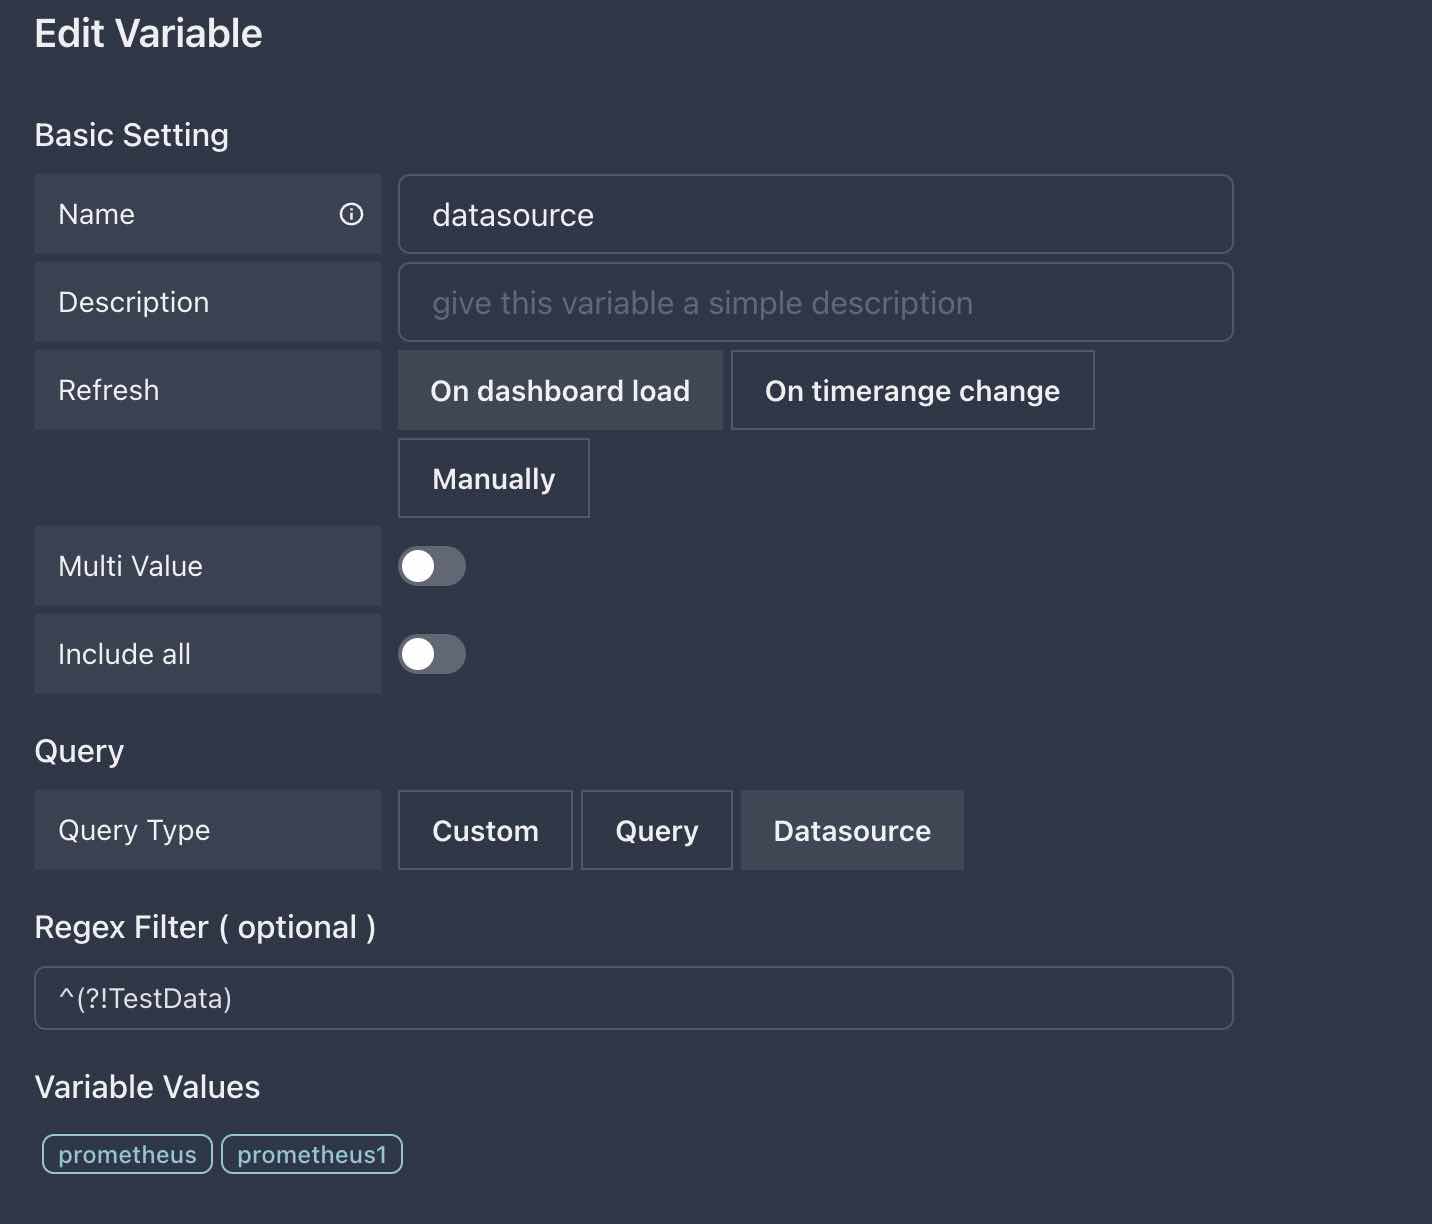
There are several things we need to pay attention to:
Multi and Alloptions all only supported by some places, datasource selection is not one of those, so we need to set theme tooff- Set
Query typetoDatasource - Use
Regex filterto filter outTestDatadatasource, because we don’t want to select it
This varialbe is easy to created, now let’s use it in panel edtitor.
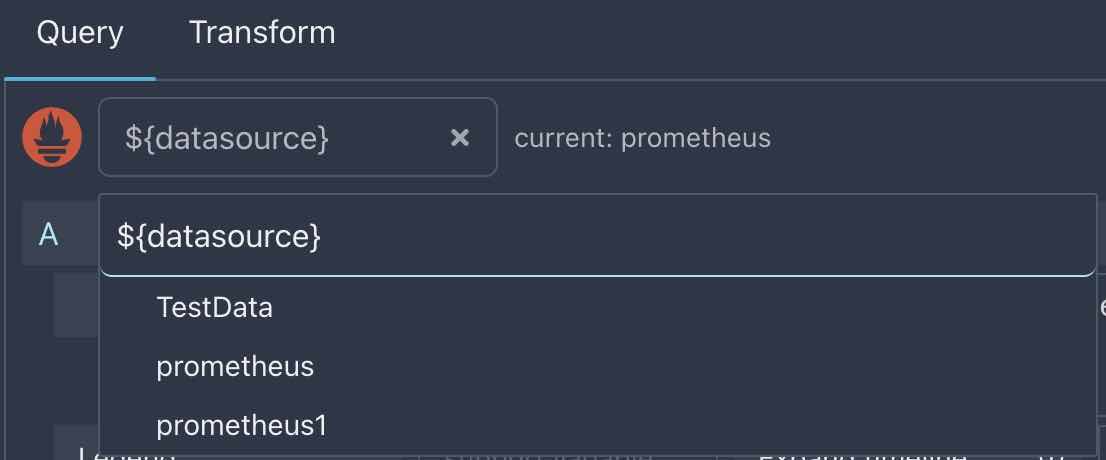
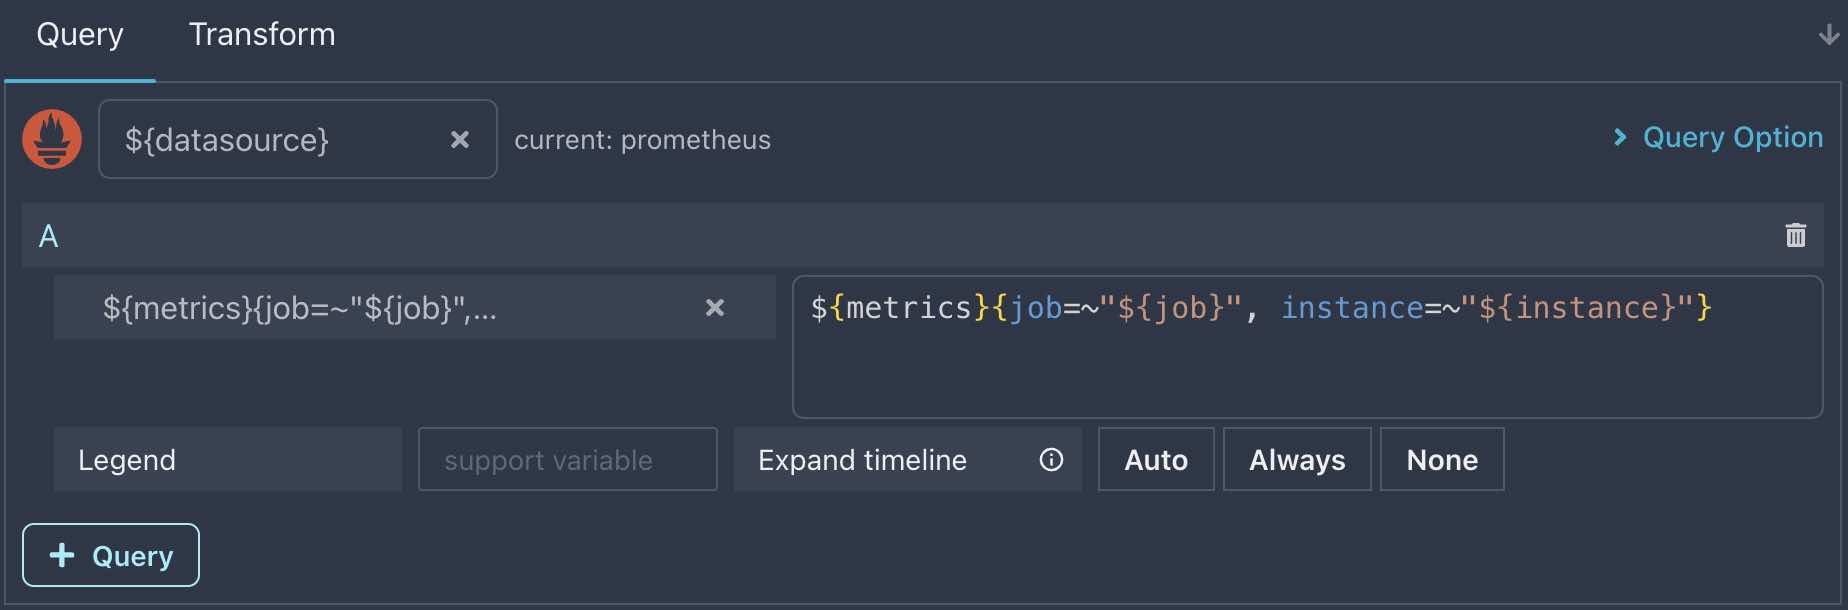
Open panel editor of go gc info panel, and find the Datasource dropdown in Query tab:
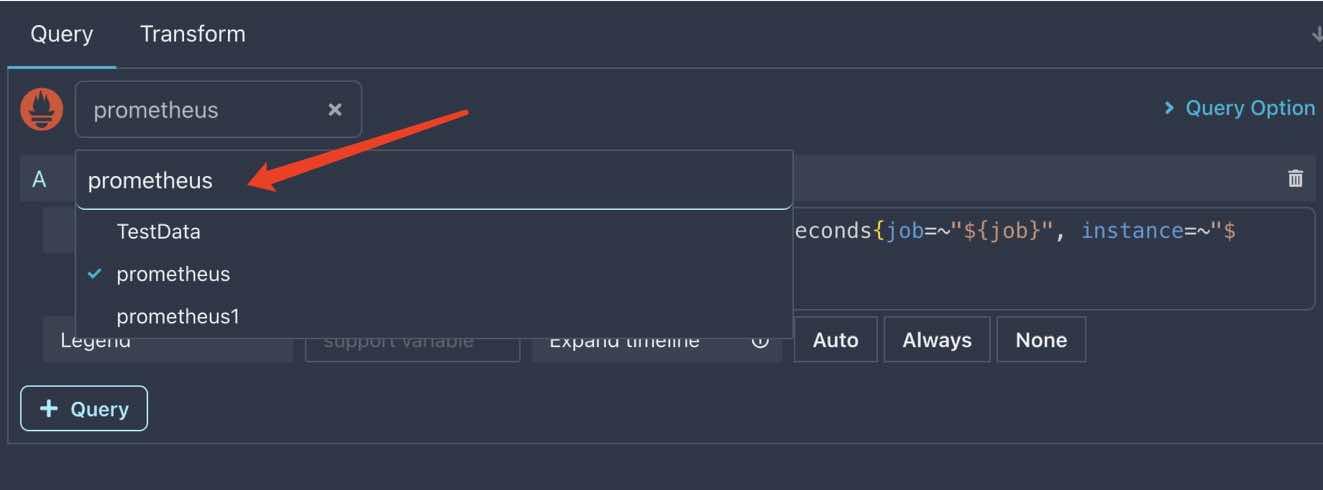
Don’t select any datasource here, we need to input ${datasource} to use our datasource variable.
Press Enter key to confirm, then input go_gc_duration_seconds{job=~"${job}", instance=~"${instance}"} as query string.
Change datasource will cause the previous query to be cleared, so you’d better copy it first before changing datasource.
Apply the changes and go back to dashboard page, change the value of datasource variable, you will see the chart data.. not changes, because we use the same datasource indeed.
Here is an excercise for our readers: try to add back TestData datasource, and change the value of datasource variable between prometheus and TestData, you will see the chart data changes.
Use variable in querying variable
When querying a variable, we can use another variable as input.
First, create a new variable named metrics :
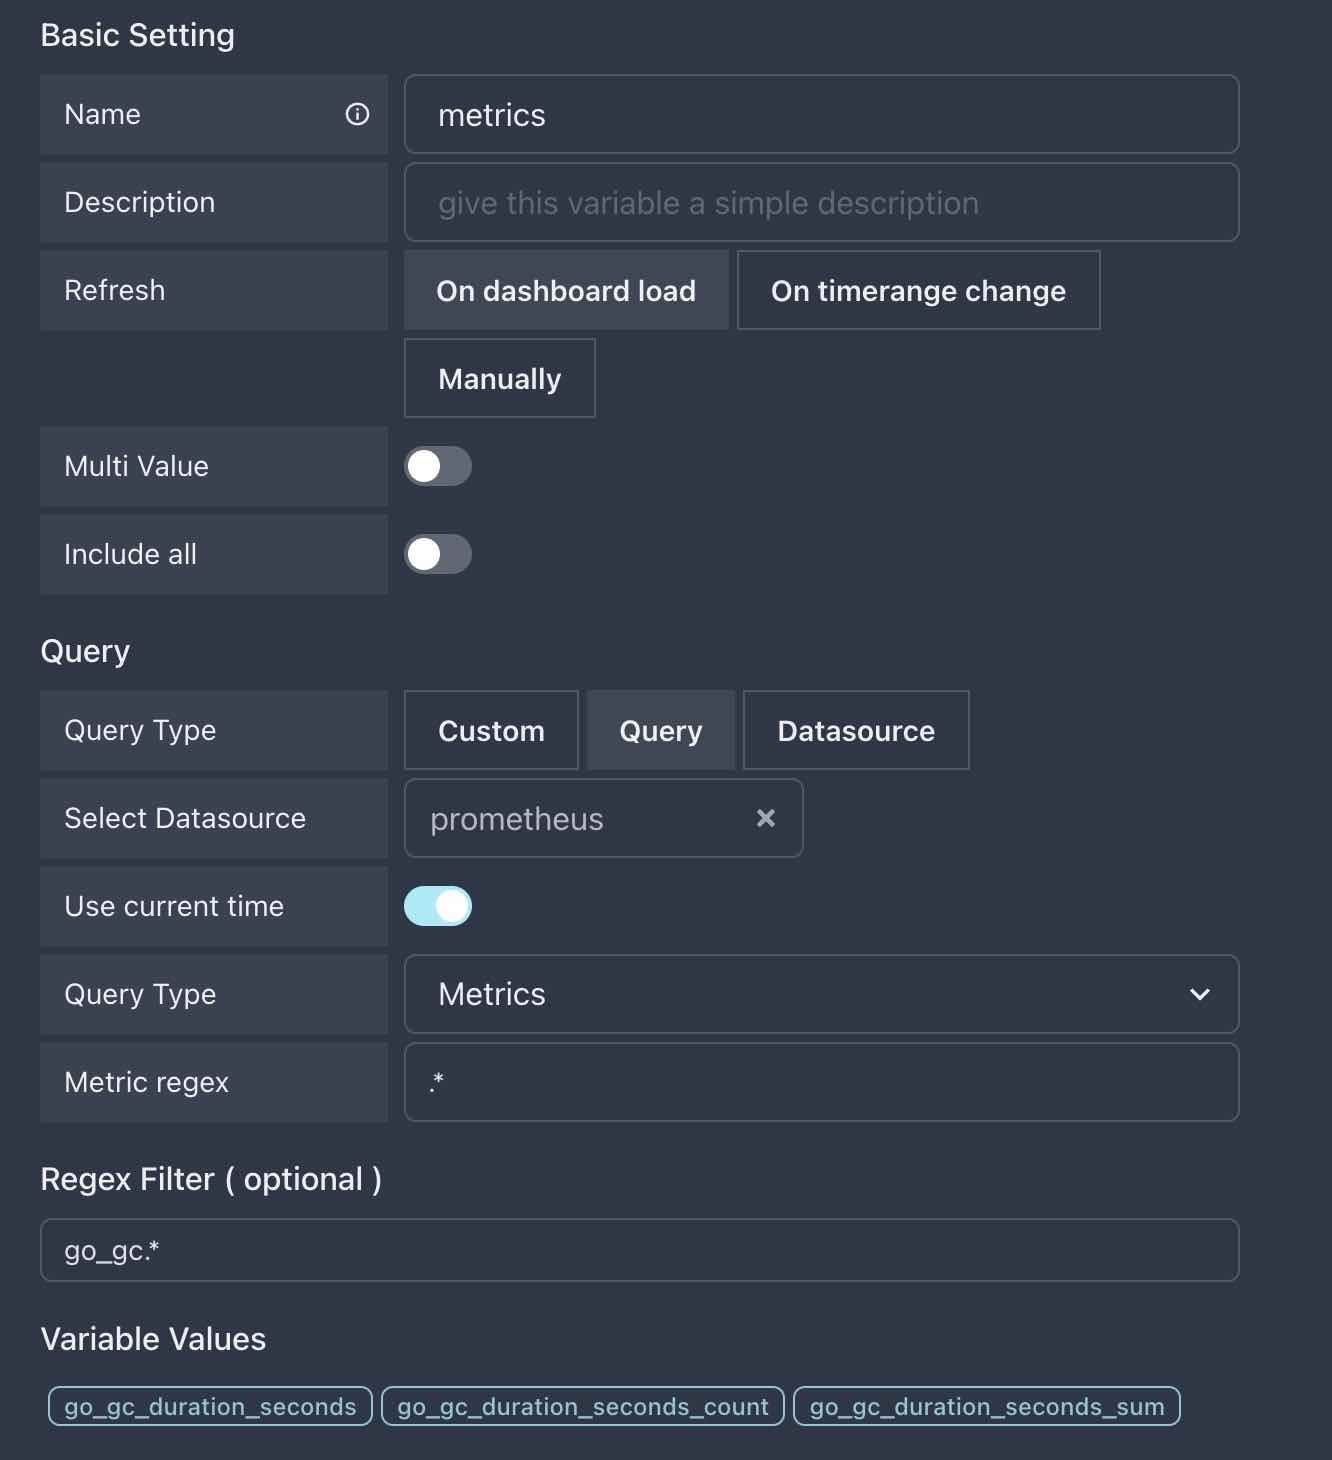
We query metrics from Prometheus datasource, and filter the metrics starts with go_gc.
More dynamic panel query
Before using metrics variable in query another variable, we can update our panel query to use it to make our panel query more dynamic.
Open panel editor, input ${metrics}{job=~"${job}", instance=~"${instance}"} in Query tab:
Click Apply button and go back to dashboard page, then select different metrics variable value to see what happens.
It seems our dashbaord is much more powerful than before, great job !
use in variable query
Now, let’s edit the instance variable created in previous section, rename it to metrics name and uses metrics variable as Metric field input:
You can see, in Query -> Metric field , rather than select a value from dropdown, we use the value from variable metrics as input.
Try to change the value of metrics variable, and see how metrics name variable changes.