- Panel Plugins
- Table
Panel Plugins
Table
Table panel is one of the most important and powerful panels in xObserve.

Next, let’s see how to configure some of the options.
Table setting -> Table width
This is most useful when there are a lot of columns in the table that are hard or impossible to display on the current view.
Then you can set the width of the table to make the table scroll horizontally.
Column width can also be set in Overrides tab.
Column -> Column filter
When enabled, xObserve will automatically assign a type related filter to each column, for example: for string type column, a text search filter will be assigned, for number type column, a number range filter will be assigned.
You can also override the filter type in Overrides tab.
Interaction
There are two ways to interact with the table:
- Click on the table row to trigger a event
- Add some action buttons in the last column
For more information, please refer to Graph interactivity, although it’s about graph, but the interaction of table is almost the same.
Value mapping
Value mapping is a very useful feature, it can map the value of a column to another value, for example, you can map the value of a column to a color, or map the value of a column to a icon.
Value mapping is only available for Table panel at this moment

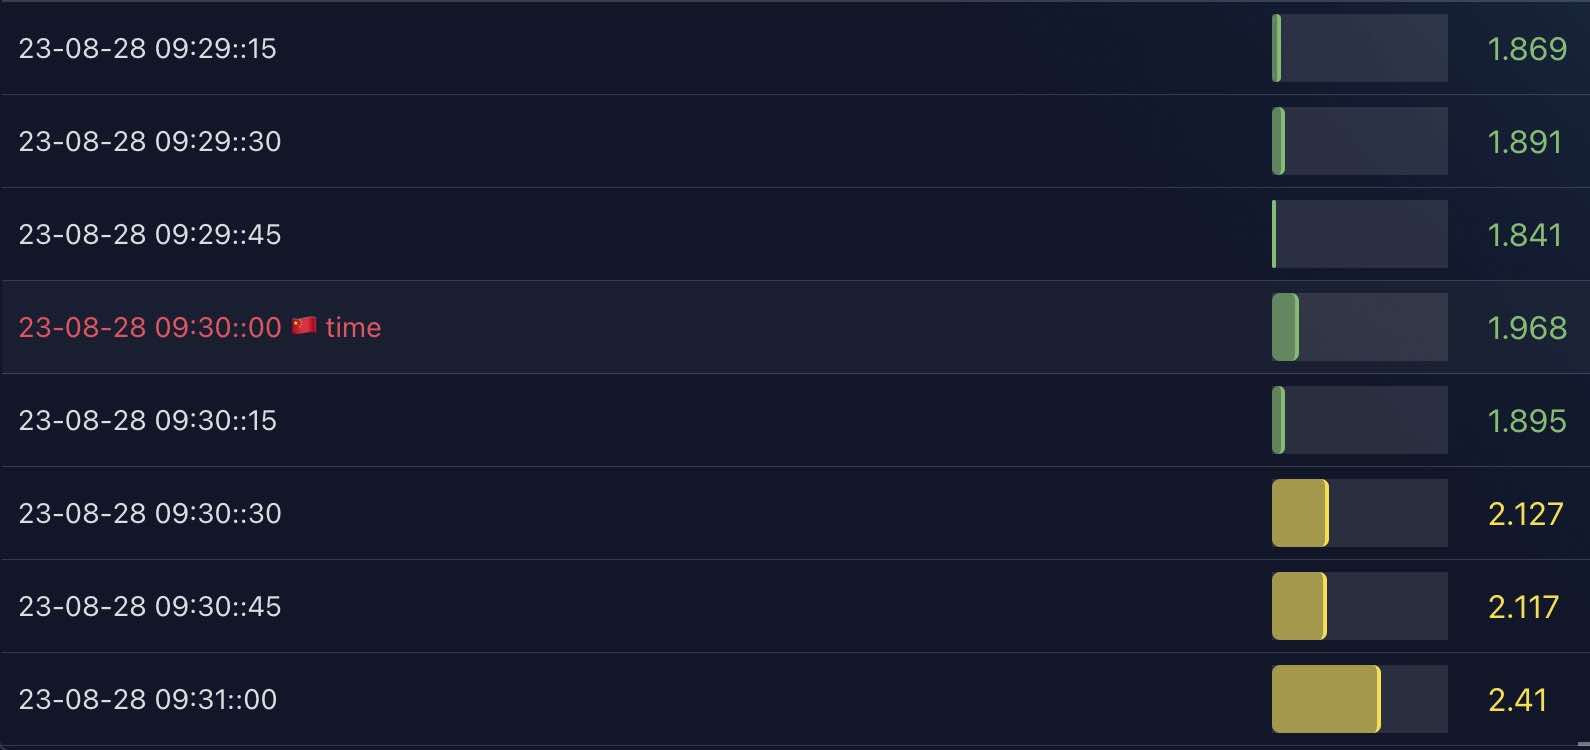
In above image, the fourth value in the first column is set with a value mapping:

In this mapping, we have created a mapping rule with type Value: mapped 23-08-28 09:30::00 to ${__current__} 🇨🇳 time, set set its color to pink-red.
You should notice that we have used a internal variable ${__current__} here to represent the raw value.
If your time column in table data it timestapms, you have to transform them to time string first

