

- Panel
- Annotation
Panel
Annotation
Using annotatin can add marks to your Graph panel chart, like this:
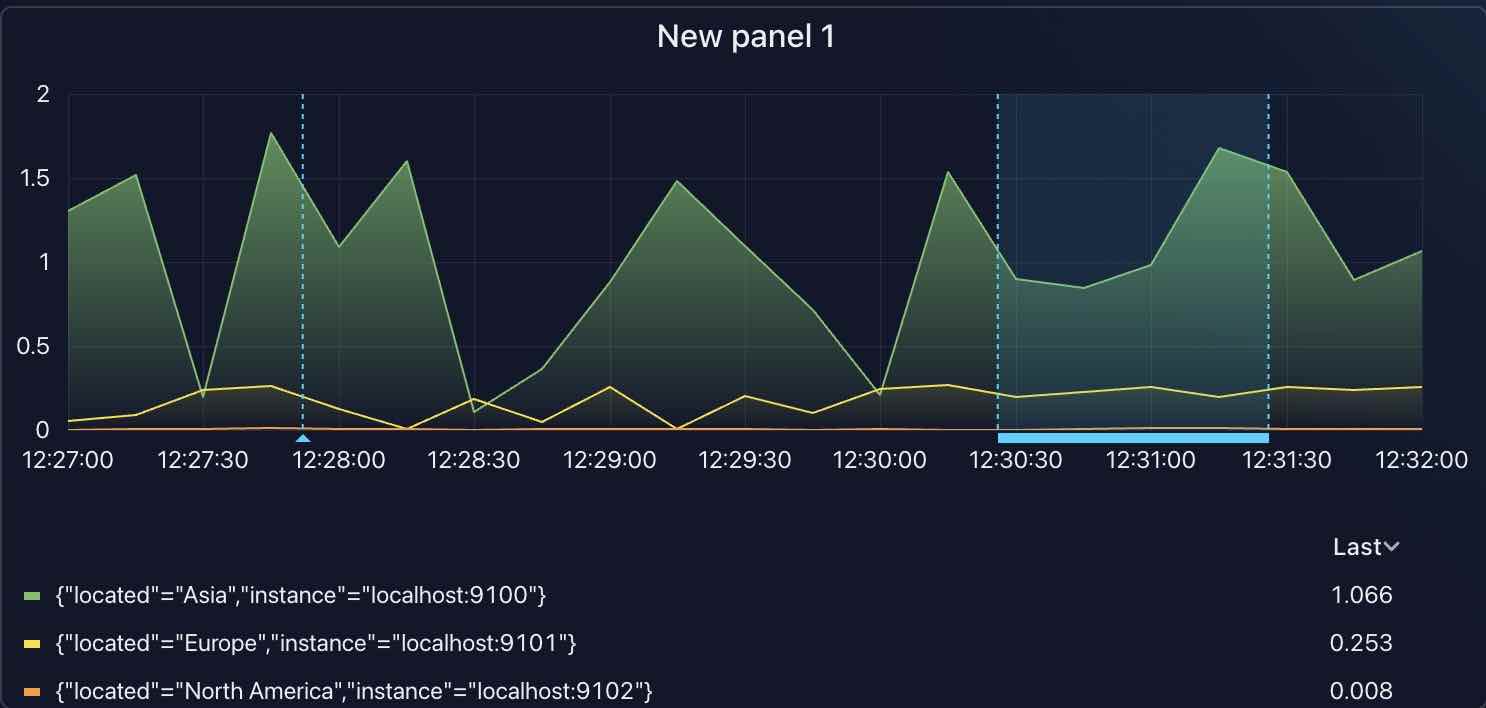
The line and range with sky blue color are our annotations. Let’s create an annotation first.
Annotation is only support in Graph panel
Annotation
Create annotation
- Add a new panel and open its panel editor, then select
Grapnvisualization for it, apply and return back to dashboard page. - Click on the Graph chart, you will see a context menu popup:
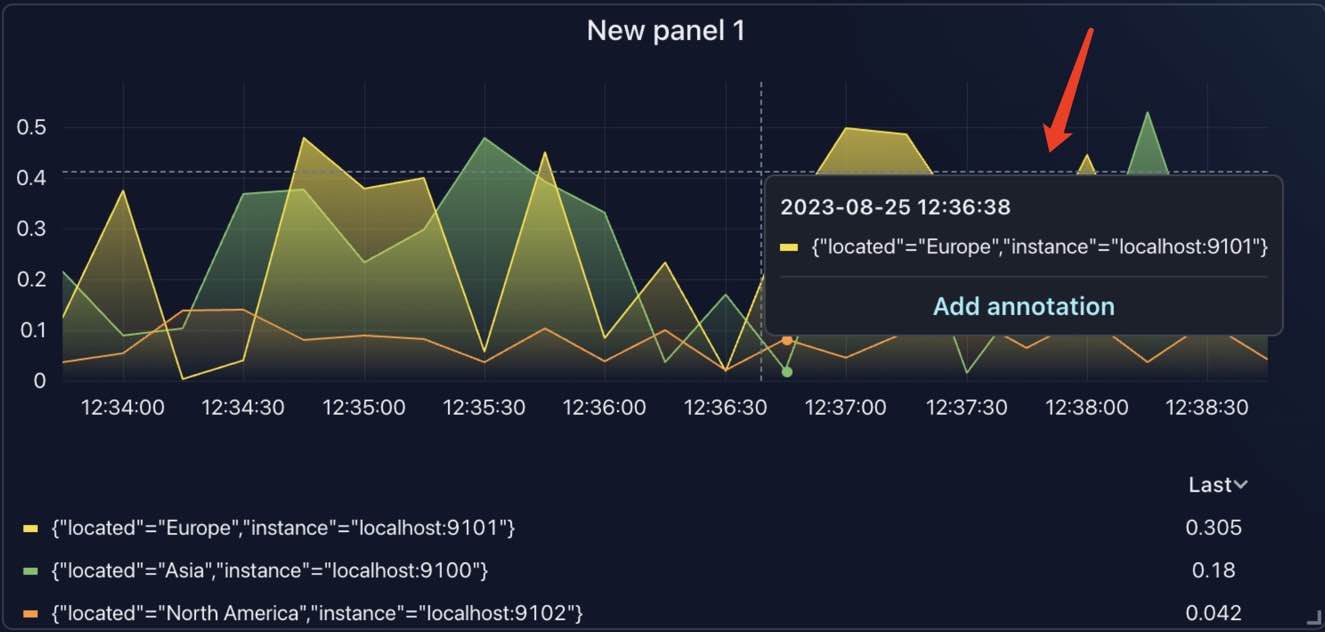
- Click
Add annotationbutton, you will see a annotation editor popup:
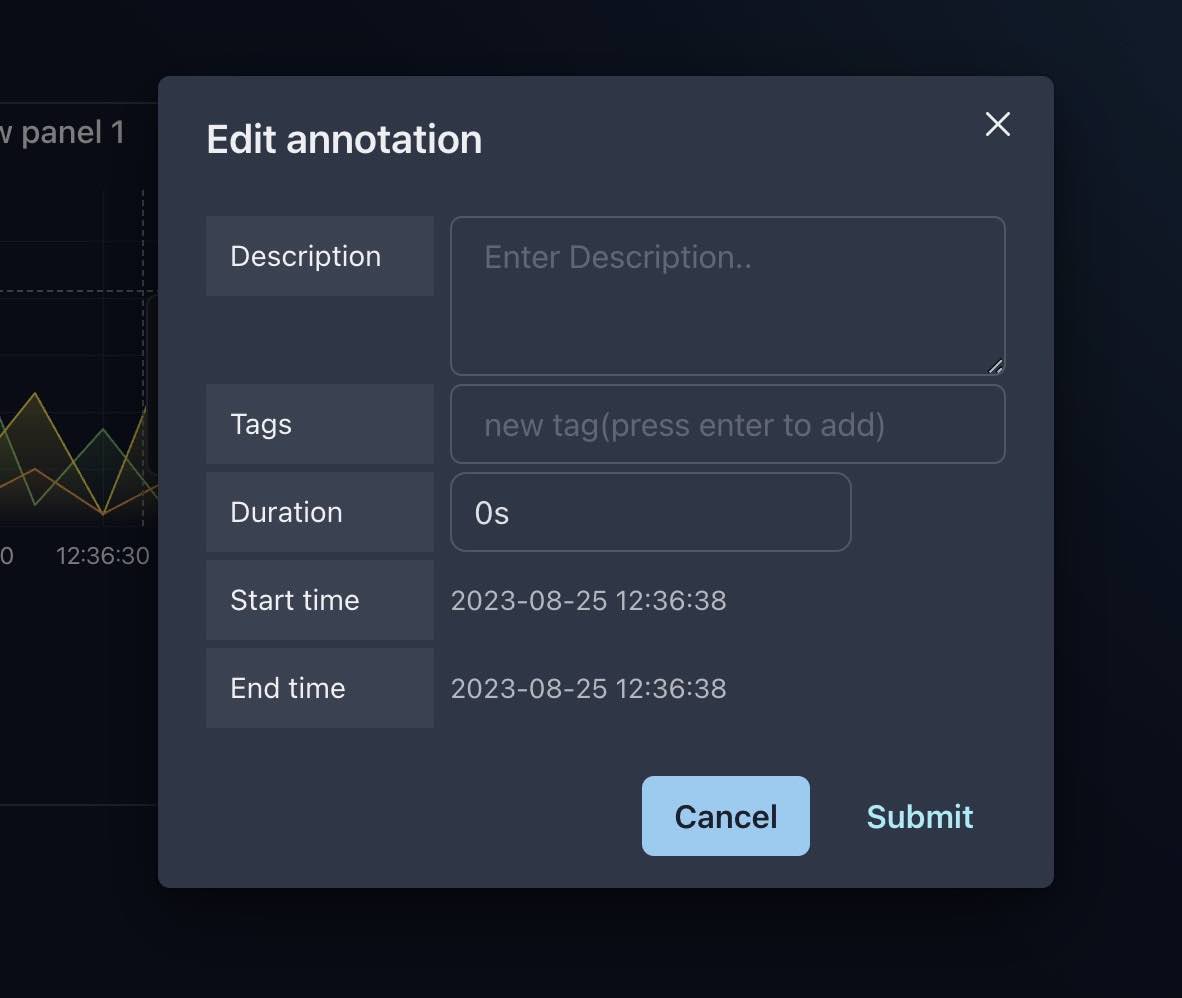
Durationfield is the time range of annotation, if you want the annotation to be a vertical line, set it to0s, otherwise set to the real timerange , let’s set it to2mhere
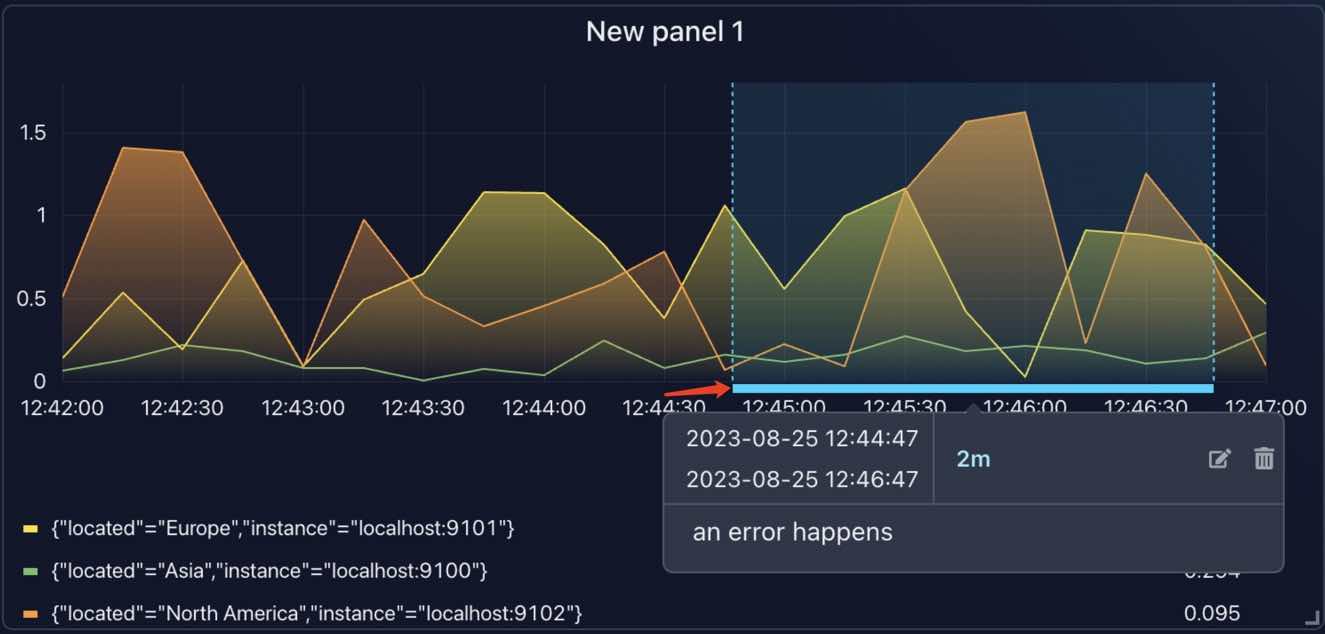
Fill in other fields and click Submit button, you will see the annotation in the chart.
View annotation
In above image, we can see an arrow points to a marker, if you hover on the marker, you will see the annotation details popup like the image above.
Edit annotation
Click the edit icon in the top right corner of the popup annotation detail card, you will see the annotation editor appeared.
We can edit annotation infos and timerange here, let’s change the Duration to 1m now, and see what will happen.
Delete annotation
Click the trash icon in the top right corner of the popup annotation detail card to delete the annotation.
Manage panel annotations
Manage annotation through chart is not convenient, so xObserve provides a panel annotation manager to manage all annotations.
- Click panel header(click where the arrow points to in below image) and click
Panel Debugmenu item
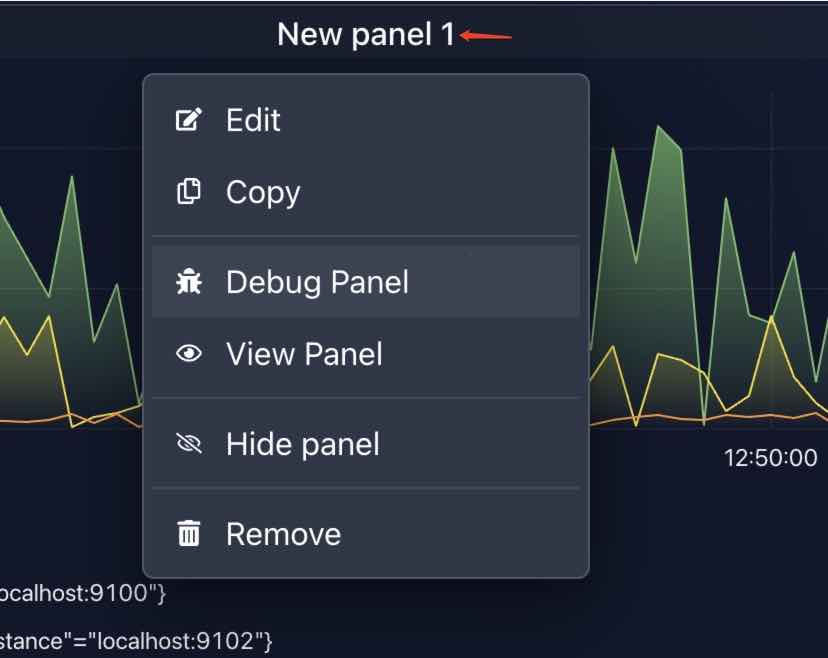
- Select
Panel Annotationstab
Now you will see all the annotations in this panel and current selected time range
Annotation settings
Open dashboard settings modal, select Annotation tab, you will see the annotation settings.
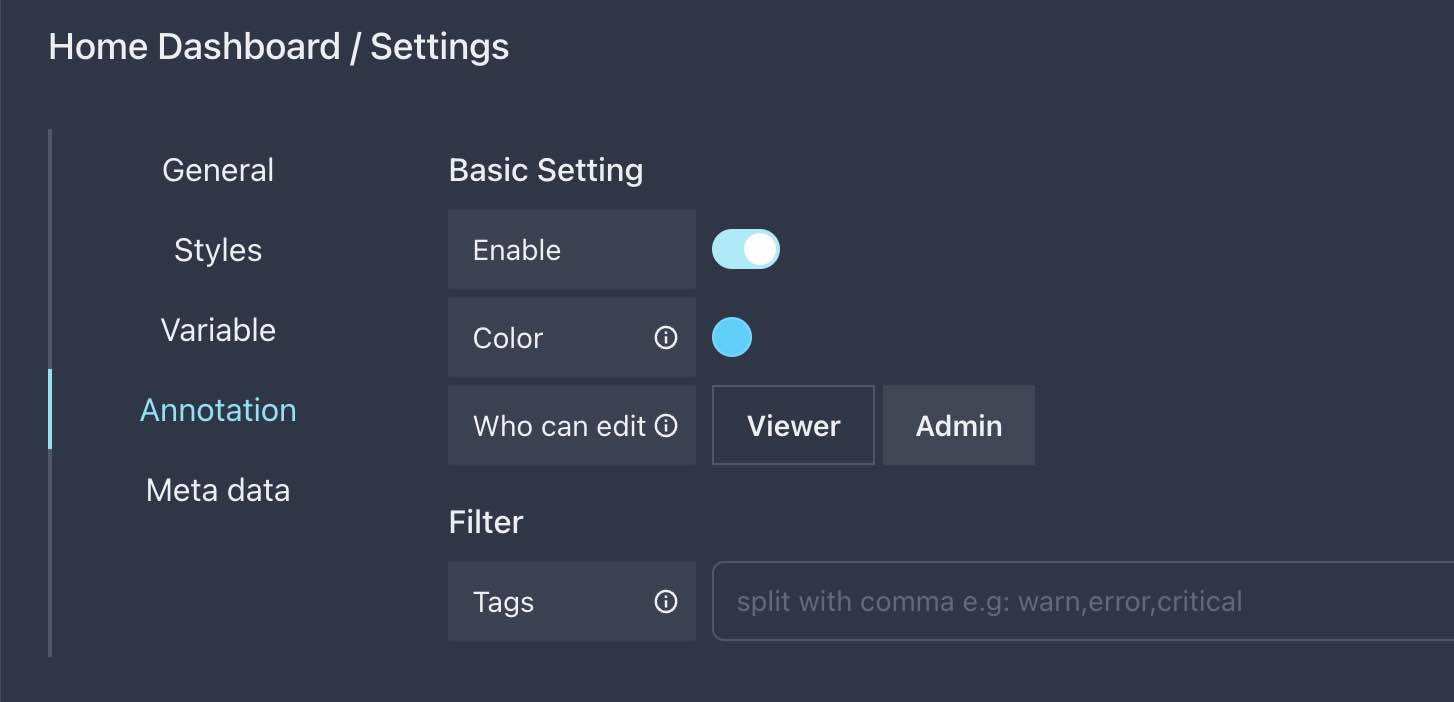
You can try:
- change the color of annotation markers
- add tags to some annotations, and set the
tags filter settingto only show the annotations which matched the tags
Correlate alert with panels
In previous tutorial, we have learned how to create an alert to Graph panel, these alerts are shown as annotations, but you can’t edit them,
because they are automatically created by xObserve, not by user.