- Tutorials
- Global variables
Tutorials
Global variables
We just learn how to use dashboard variables, they are powerful, but they have limitations: dashboard variable can only be used in the dashboard where they are defined.
Assuming we have two dashboard: server hosts and network traffic, they are all about host monitoring, so they should share a same variable: host: when we set host to A in a dashboard, then we switch to another dashboard, we want the host variable to be A too.
In a word: all dahsobards share a same variable and the same selected value.
Grafana has global variables, but they are predefined built-in variable, you can’t define your own
Global variables and Dashboard variables share the same syntax, the only difference is that Global variables are defined out of dashboards.
Create global variables
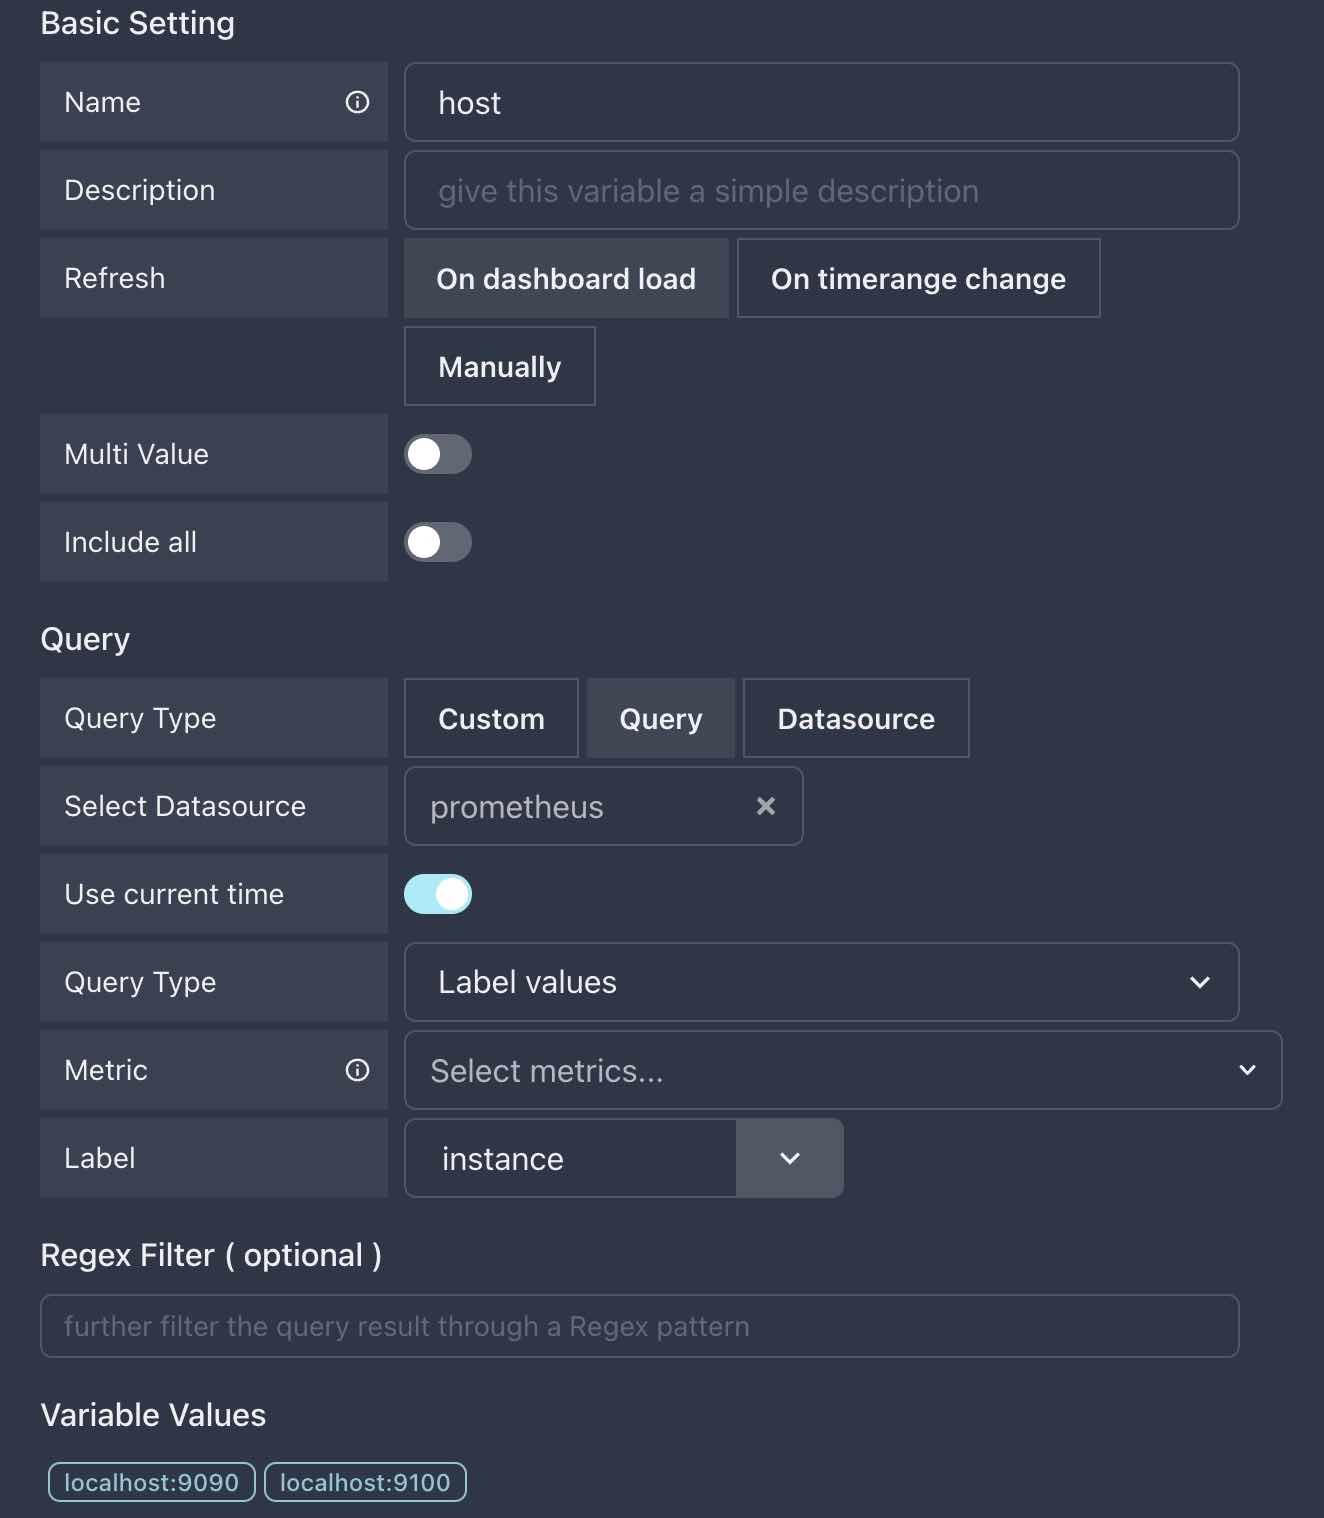
Let’s create a global variable named host:
- Click
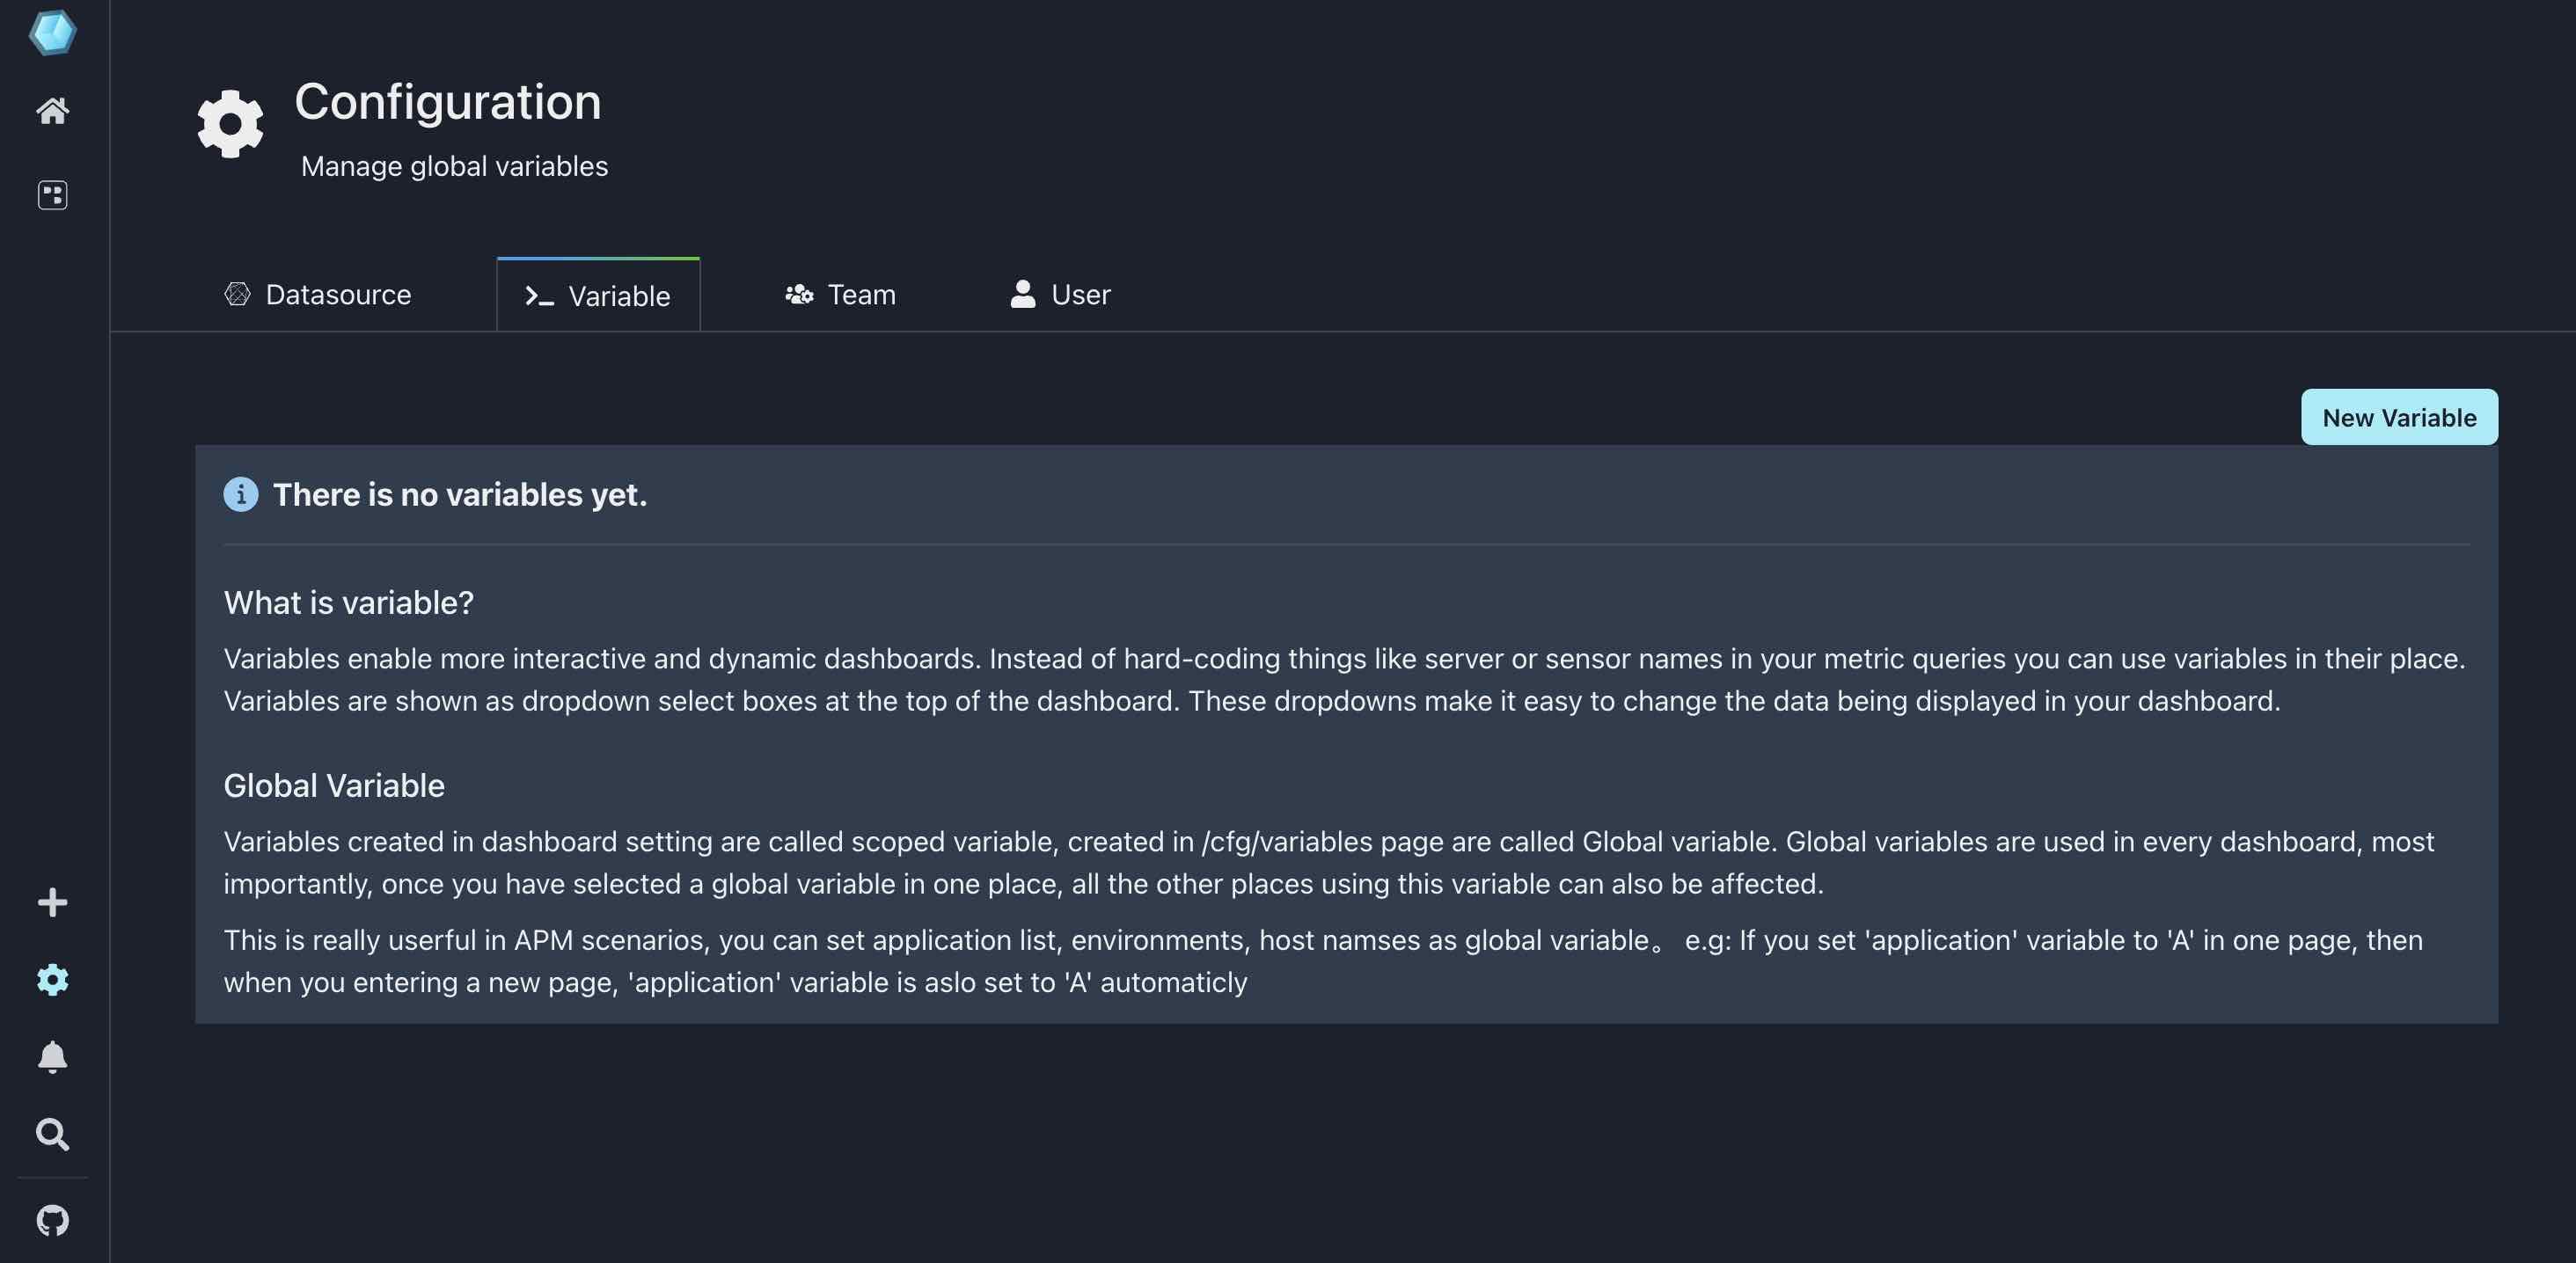
configurationicon in the bottom section of sidebar and selectVariabletab

- Click
New variablebutton to open variable editor - Fill in the form as below

aha, looks exactly the same as dashboard variable, so you should be familiar with it.
Yep, host is just another instance, it is the same as instance variable we created in previous doc, only difference is that host is a global variable, it can be used in any dashboard.
Click Submit button, you should see it appears in global variables table.

Use global variables
Using global variable is also the same as dashboard variable.
Let’s go back to Hosts info dashboard, and see what has changed to the variables selector row.

Yep, opposite to dashboard variable, global variable appeared in the right side of varaibles selector row.
Now, you should visit Home dashboard and User stats dashboard to confirm host variable is there too.
Select once changes everywhere
The most important feature of global variable is : if you set host to value A in one dashbaord, then all the other dashboard will also set host to A.
Let’s try it, first, in Hosts info dashboard, set host to localhost:9100, then switch to Home and User stats dashboard to see its value, you should see:


Great, they are changed to the same value as we expected.

