

title: Query data from Prometheus description:
The dashboard we created in previous docs is powerful, but it has a huge limitation: it query data from Testdata datasource, which is a fake datasource. It’s time to use real datasource to build a real dashboard.
In this doc, we will use Prometheus as datasource to build a dashboard, so you need:
- Install prometheus first, and make sure the Prometheus server is running.
- Start the node_exporter binary in prometheus directory, this service will collect cpu,memory,disk,network info from your machine.
Let’s assume Prometheus is running on http://localhost:9090 . First, we need to create a new datasource for Prometheus.
Create Prometheus datasource
Click + button in the bottom section of sidebar, and select New Datasource tab.
Then fill the form as below:
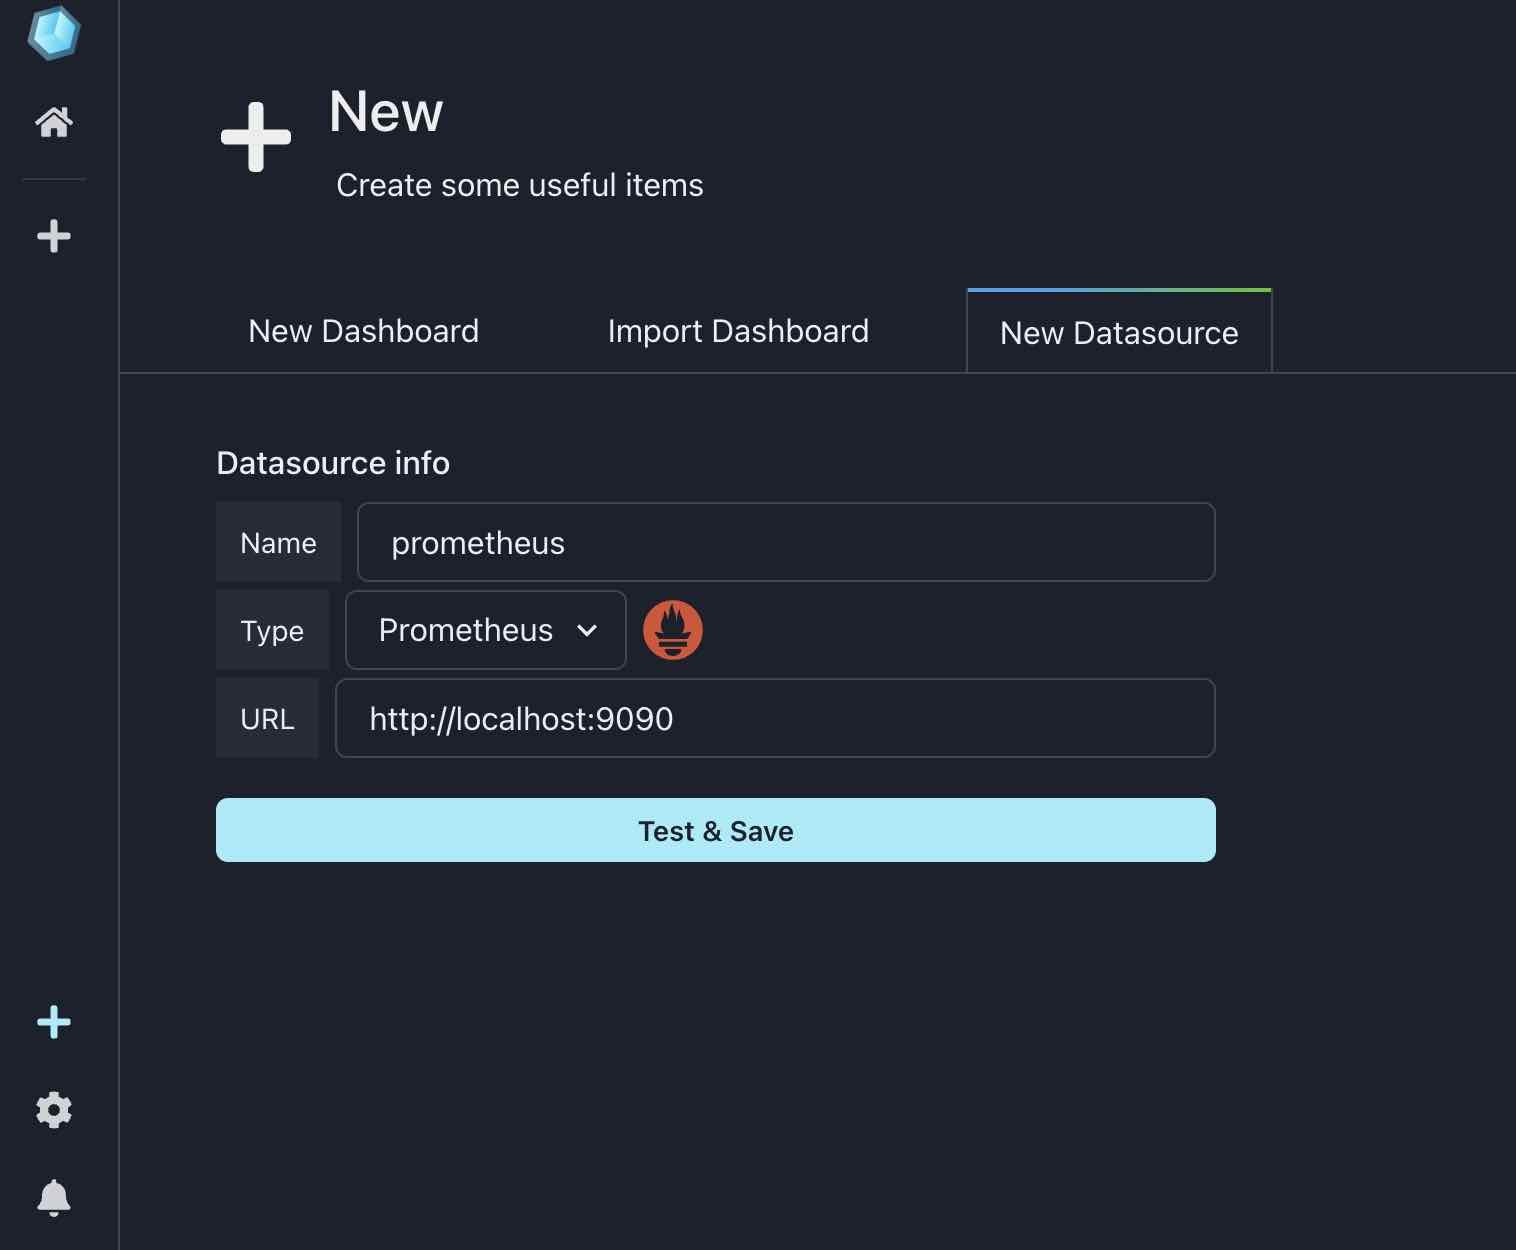
Click Save & Test button, if everything is ok, you will see a green message Datasource is added, redirecting.. in the bottom of the form.
Then the page will redirect to datasources managing page:
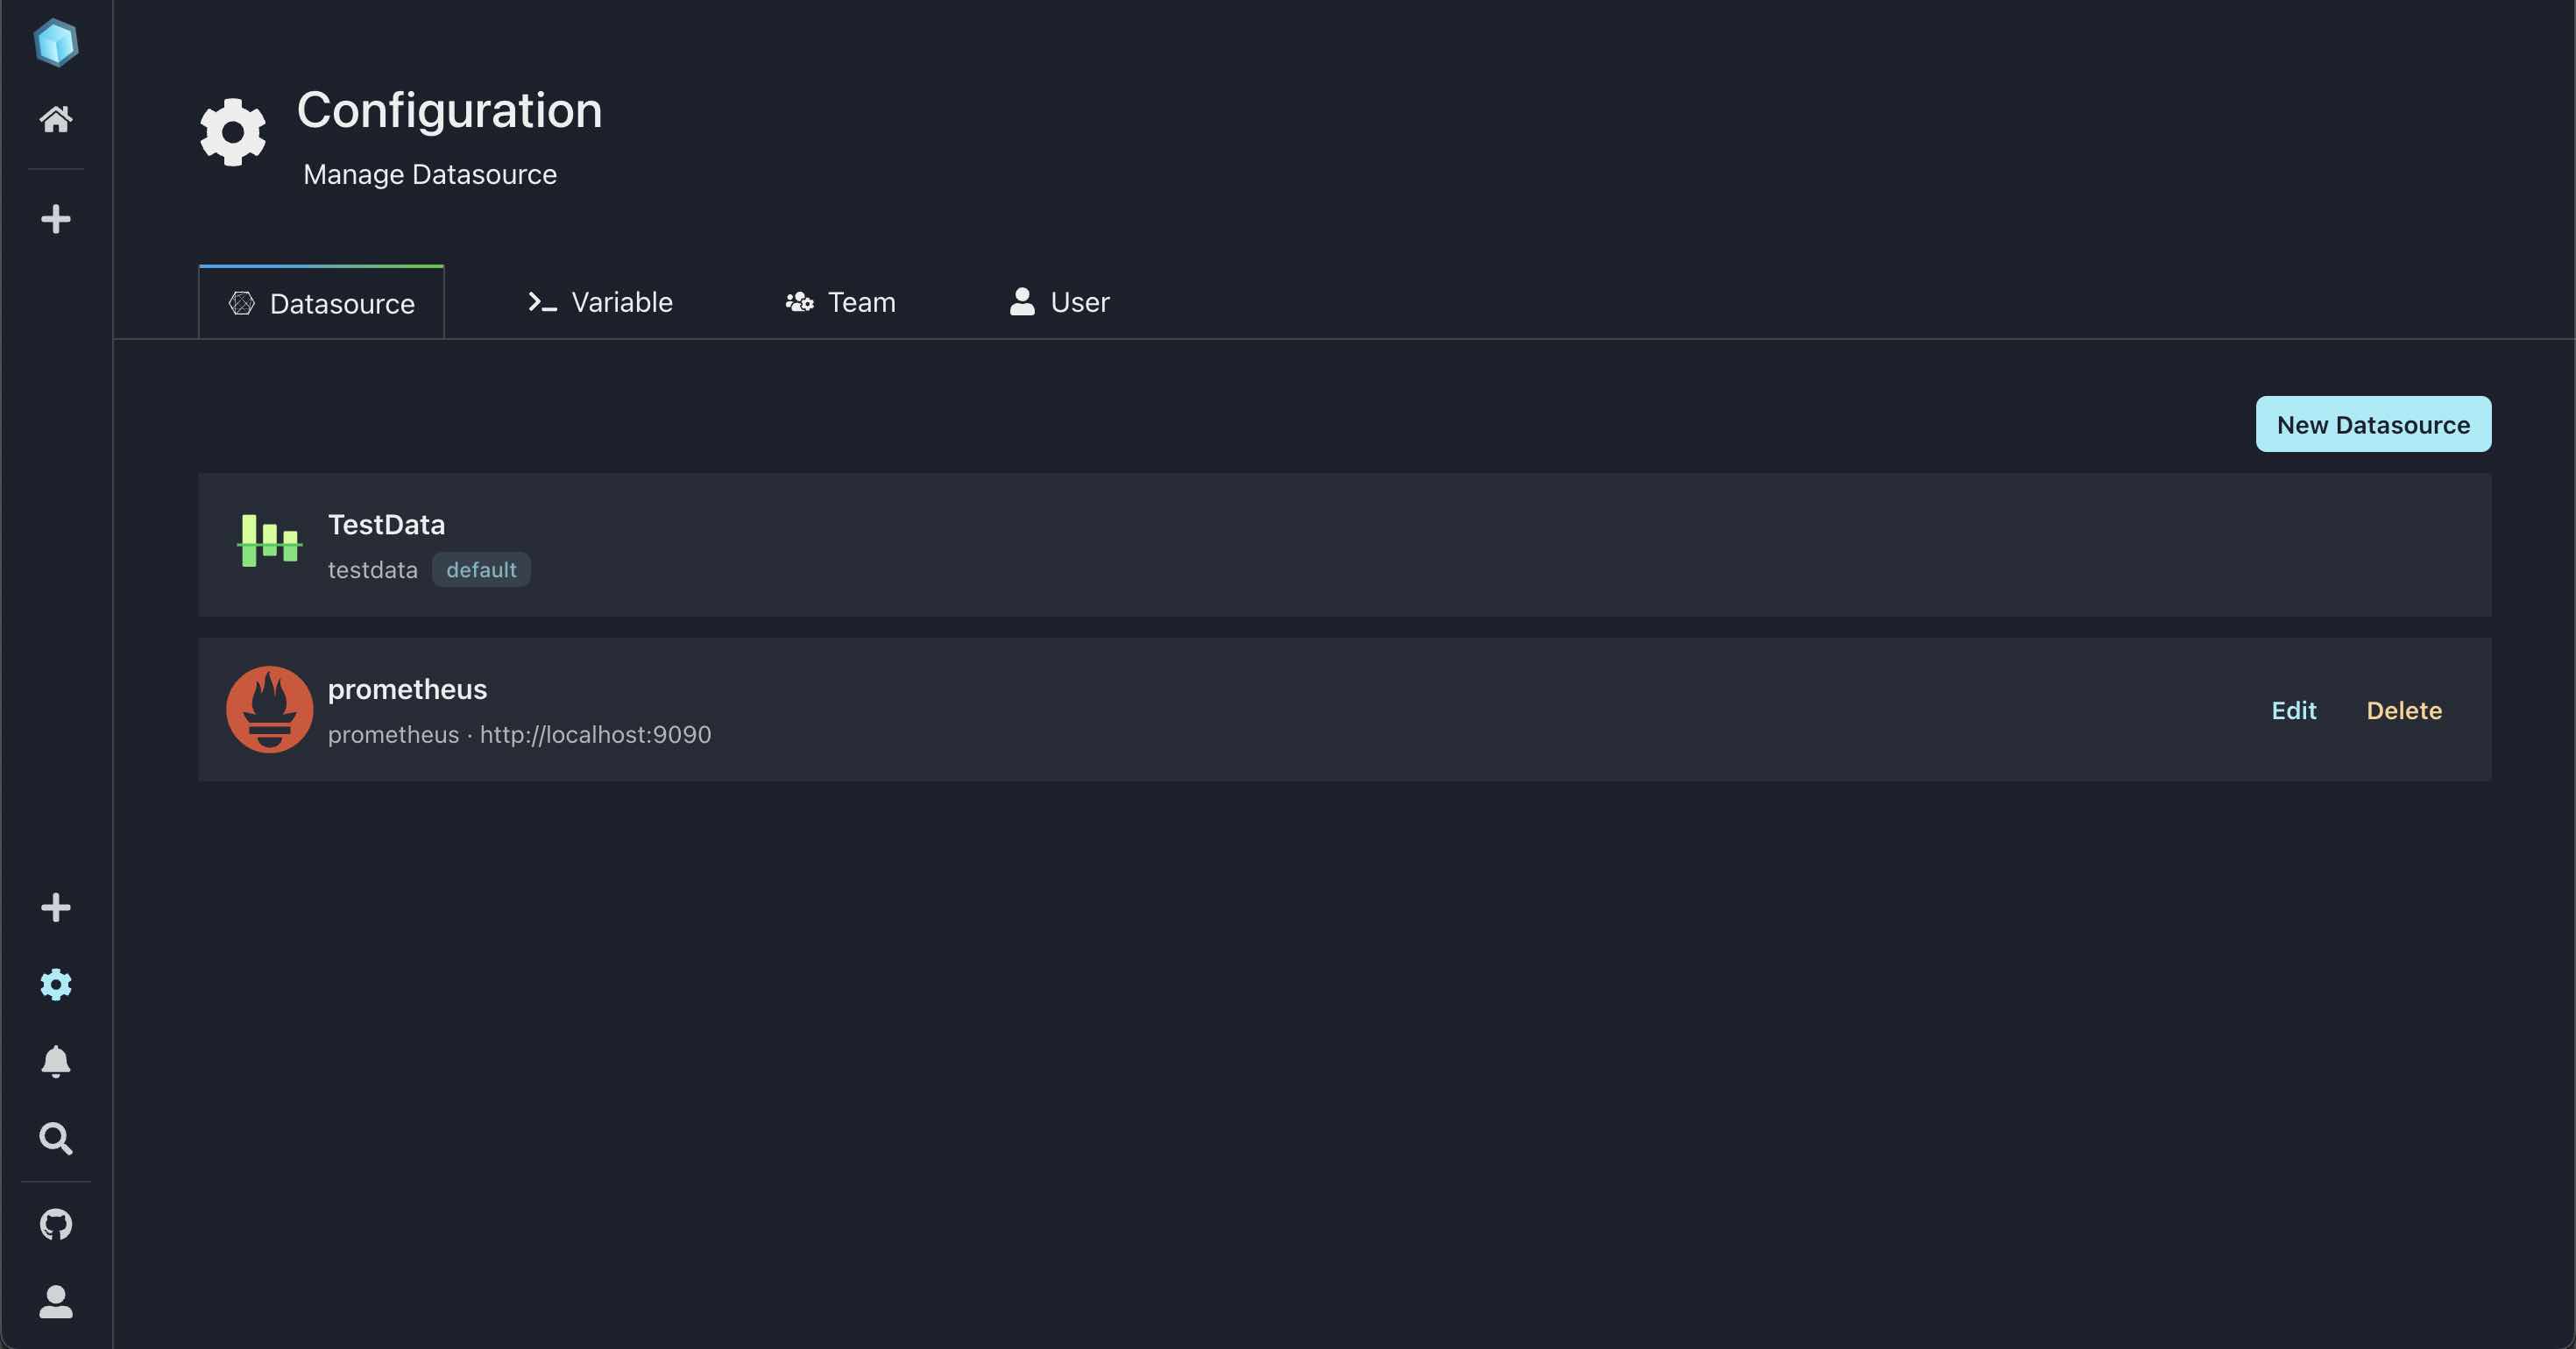
You can see Prometheus datasource is listed in the table, next to the default Testdata datasource which we used in previous docs.
Select panel datasource
Before querying data from Prometheus, we need to create a new dashboard first, let’s name it ‘Hosts info’.
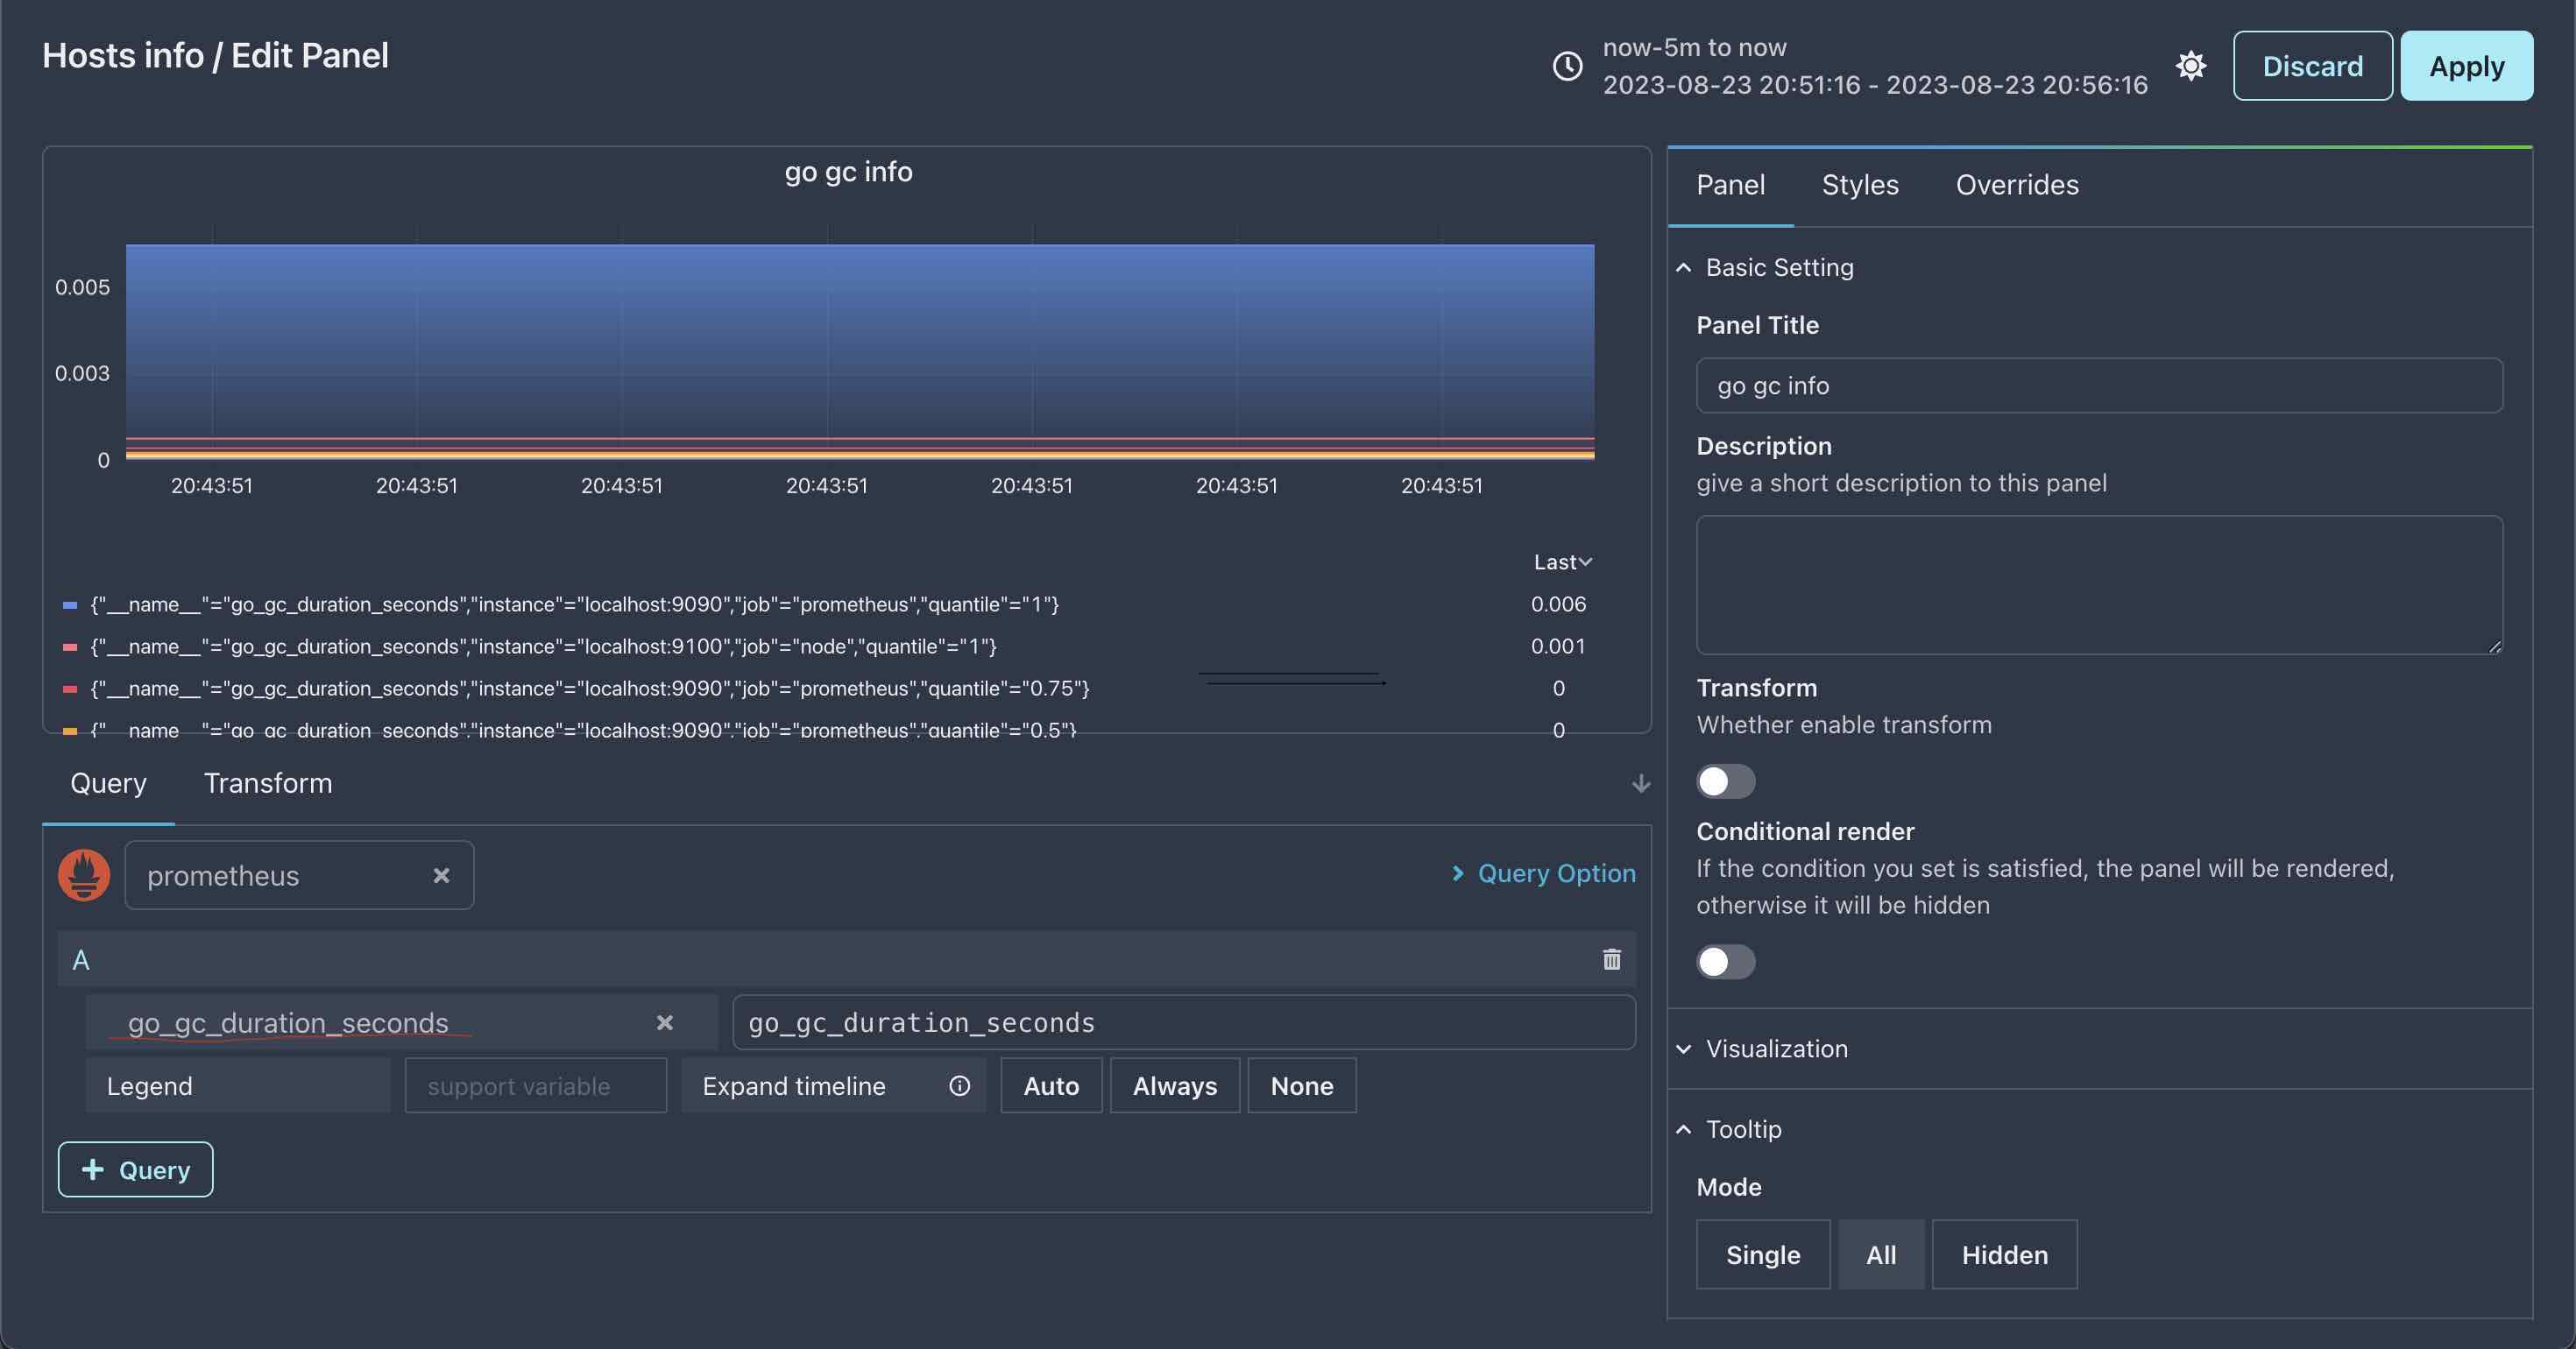
Then add a new table named go gc info , open panel editor and select Graph visulization.
Look at the Query tab on the left bottom of panel editor, you can see the default datasource is Testdata currently, we need to change it to Prometheus .
Query data from Prometheus
From panel name, we can know that this panel is used to query go gc info from Prometheus, so we need to write a PromQL query to get the data, there are two ways:
Write PromQL query manually
Find a input box which prompt you Enter a PromQL query , and then type go_gc_duration_seconds , you will see the result as below.
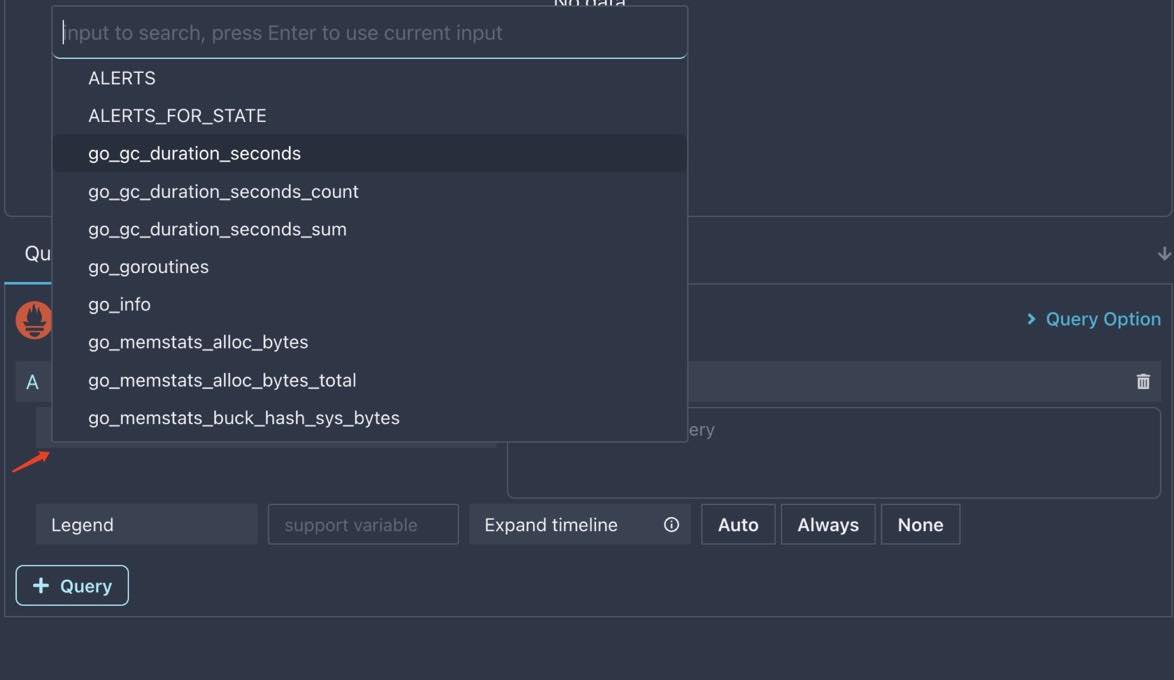
Select metrics from metrics list
Have you noticed the red line in the above image ? We can select metrics from there, click the red line, and then select go_gc_duration_seconds , you will see the same result as above image.
Legend
We can change Graph legend names by using Prometheus legend, let’s create a new panel named: Cpu idle, and then open panel editor, select Graph visulization and Prometheus datasource.
This panel will show cpu idle usage of our host servers, to achive this, type sum(rate(node_cpu_seconds_total{mode="idle"}[1m])) by (instance) / sum(rate(node_cpu_seconds_total[1m])) by (instance) * 100 in PromQL input box,
then set legend to cpu idle - {{instance}}, result is as below:
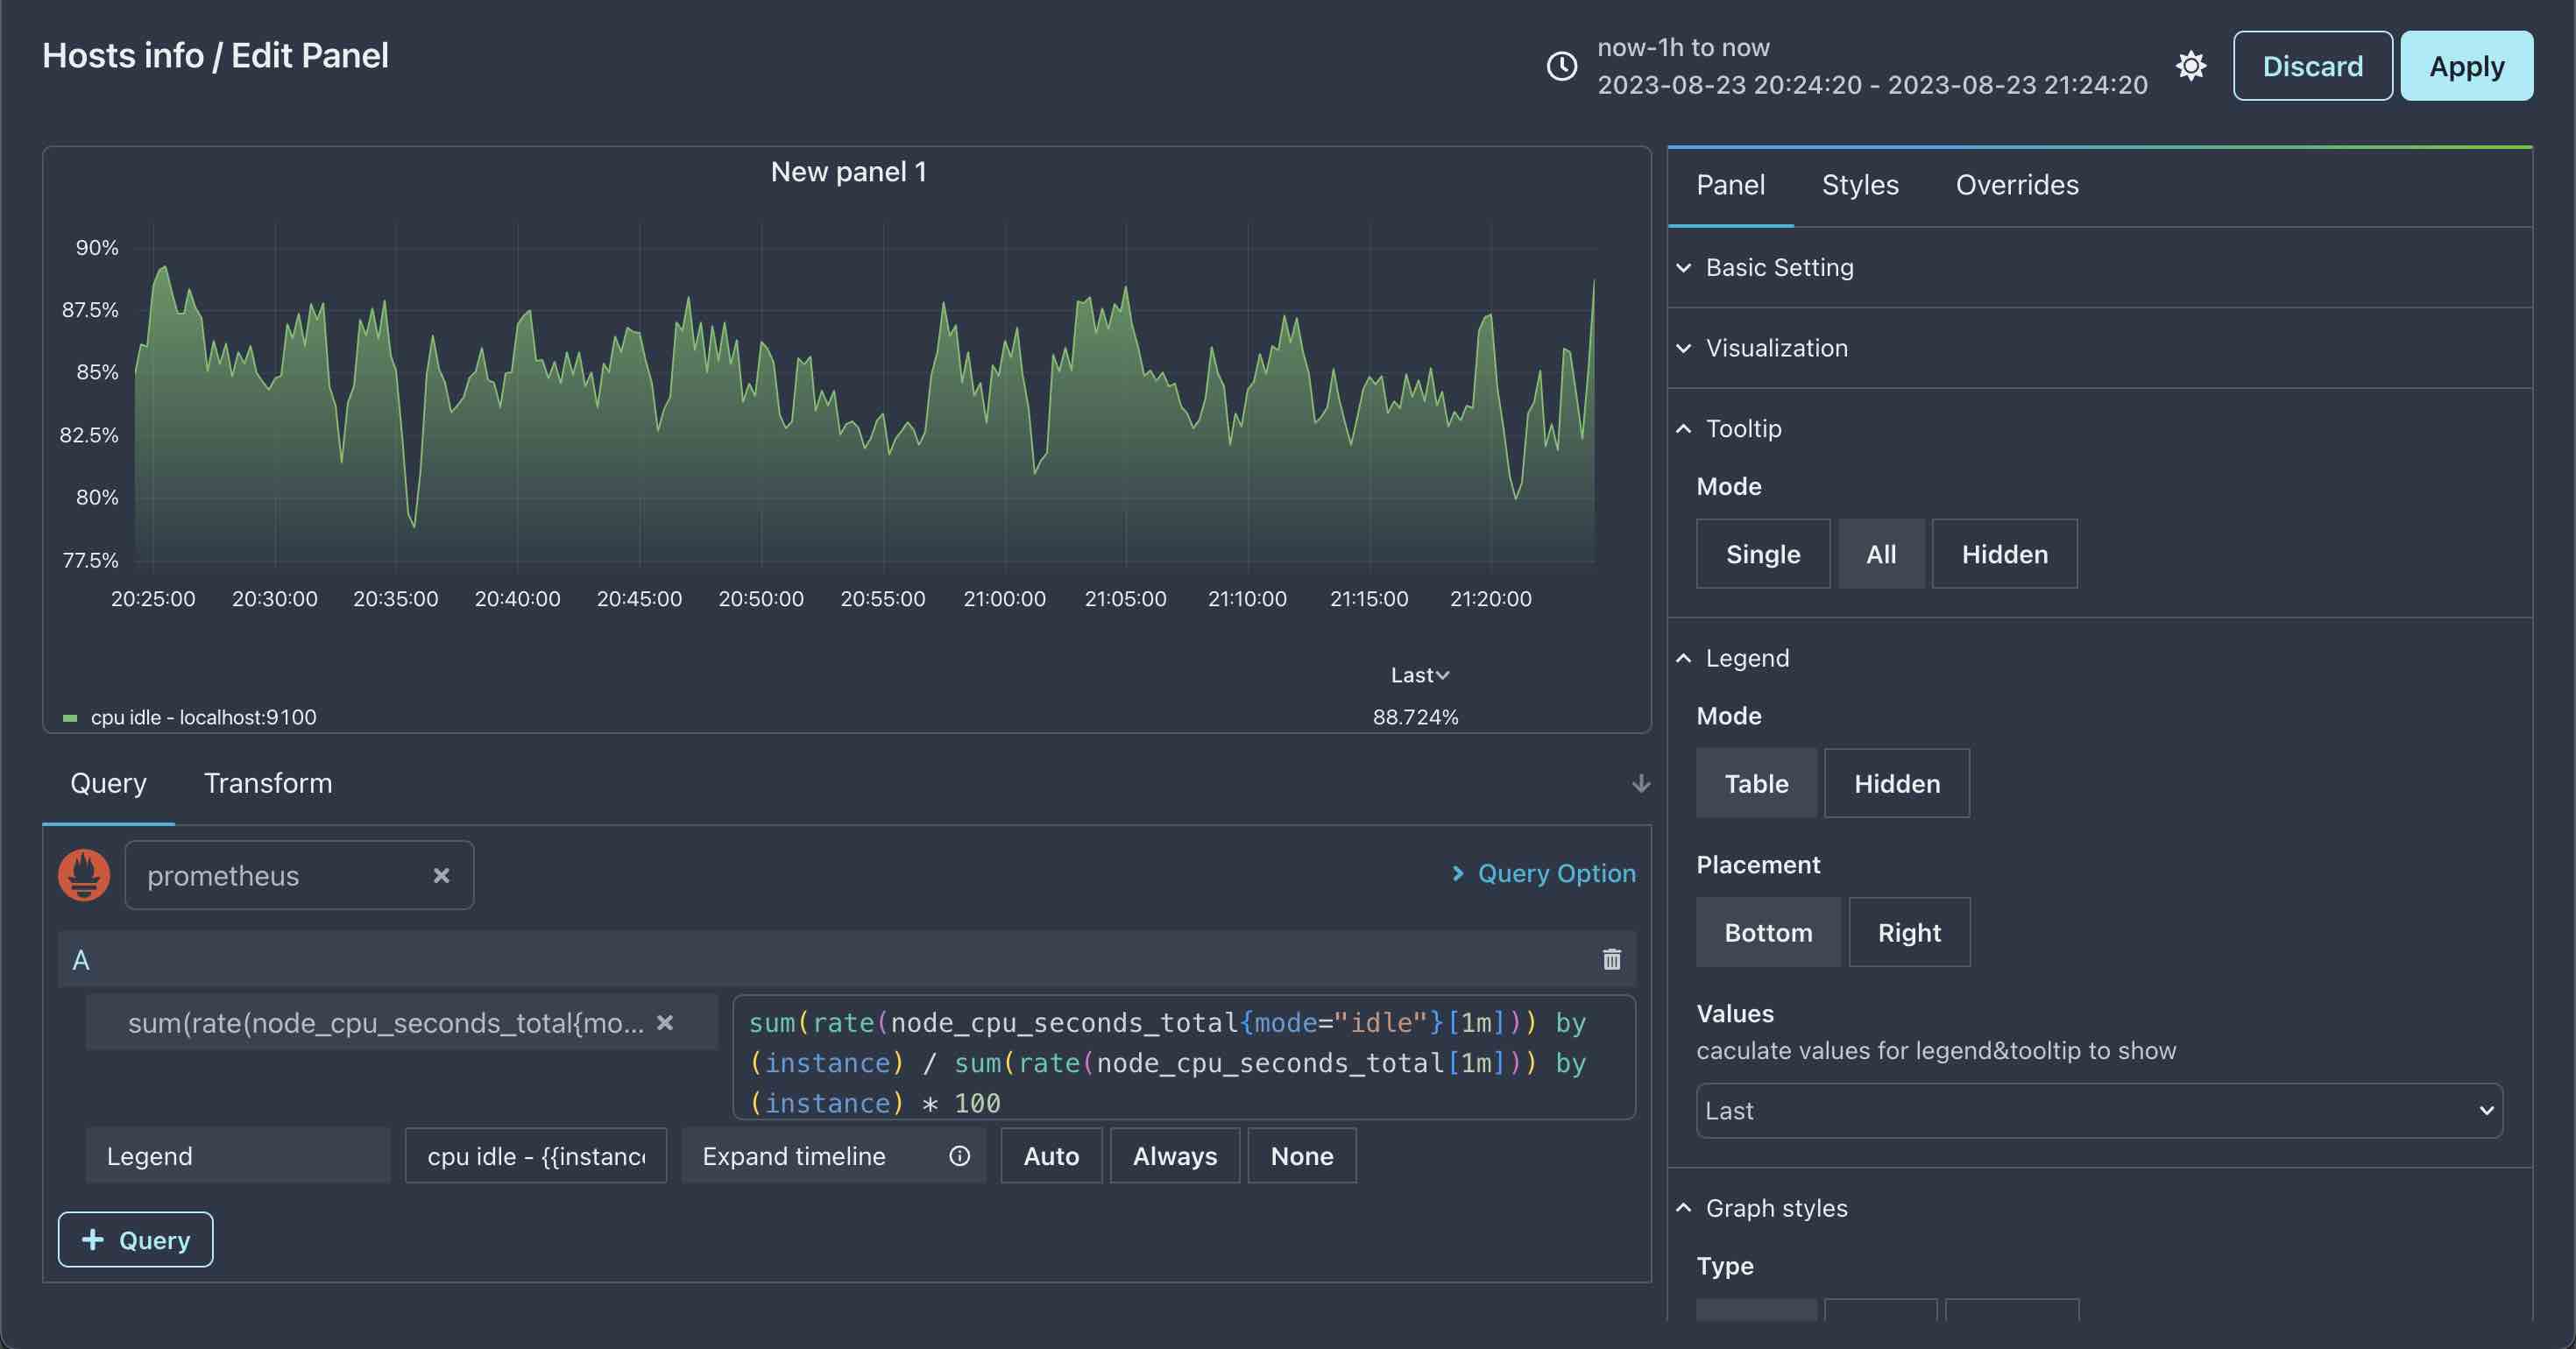
In above result, {{instance}} is replaced by instance label value in query result.
Don’t forget to add units to
cpu idlepanel,%is a good choice.