

- Panel Plugins
- Dependency graph
Panel Plugins
Dependency graph
Filter
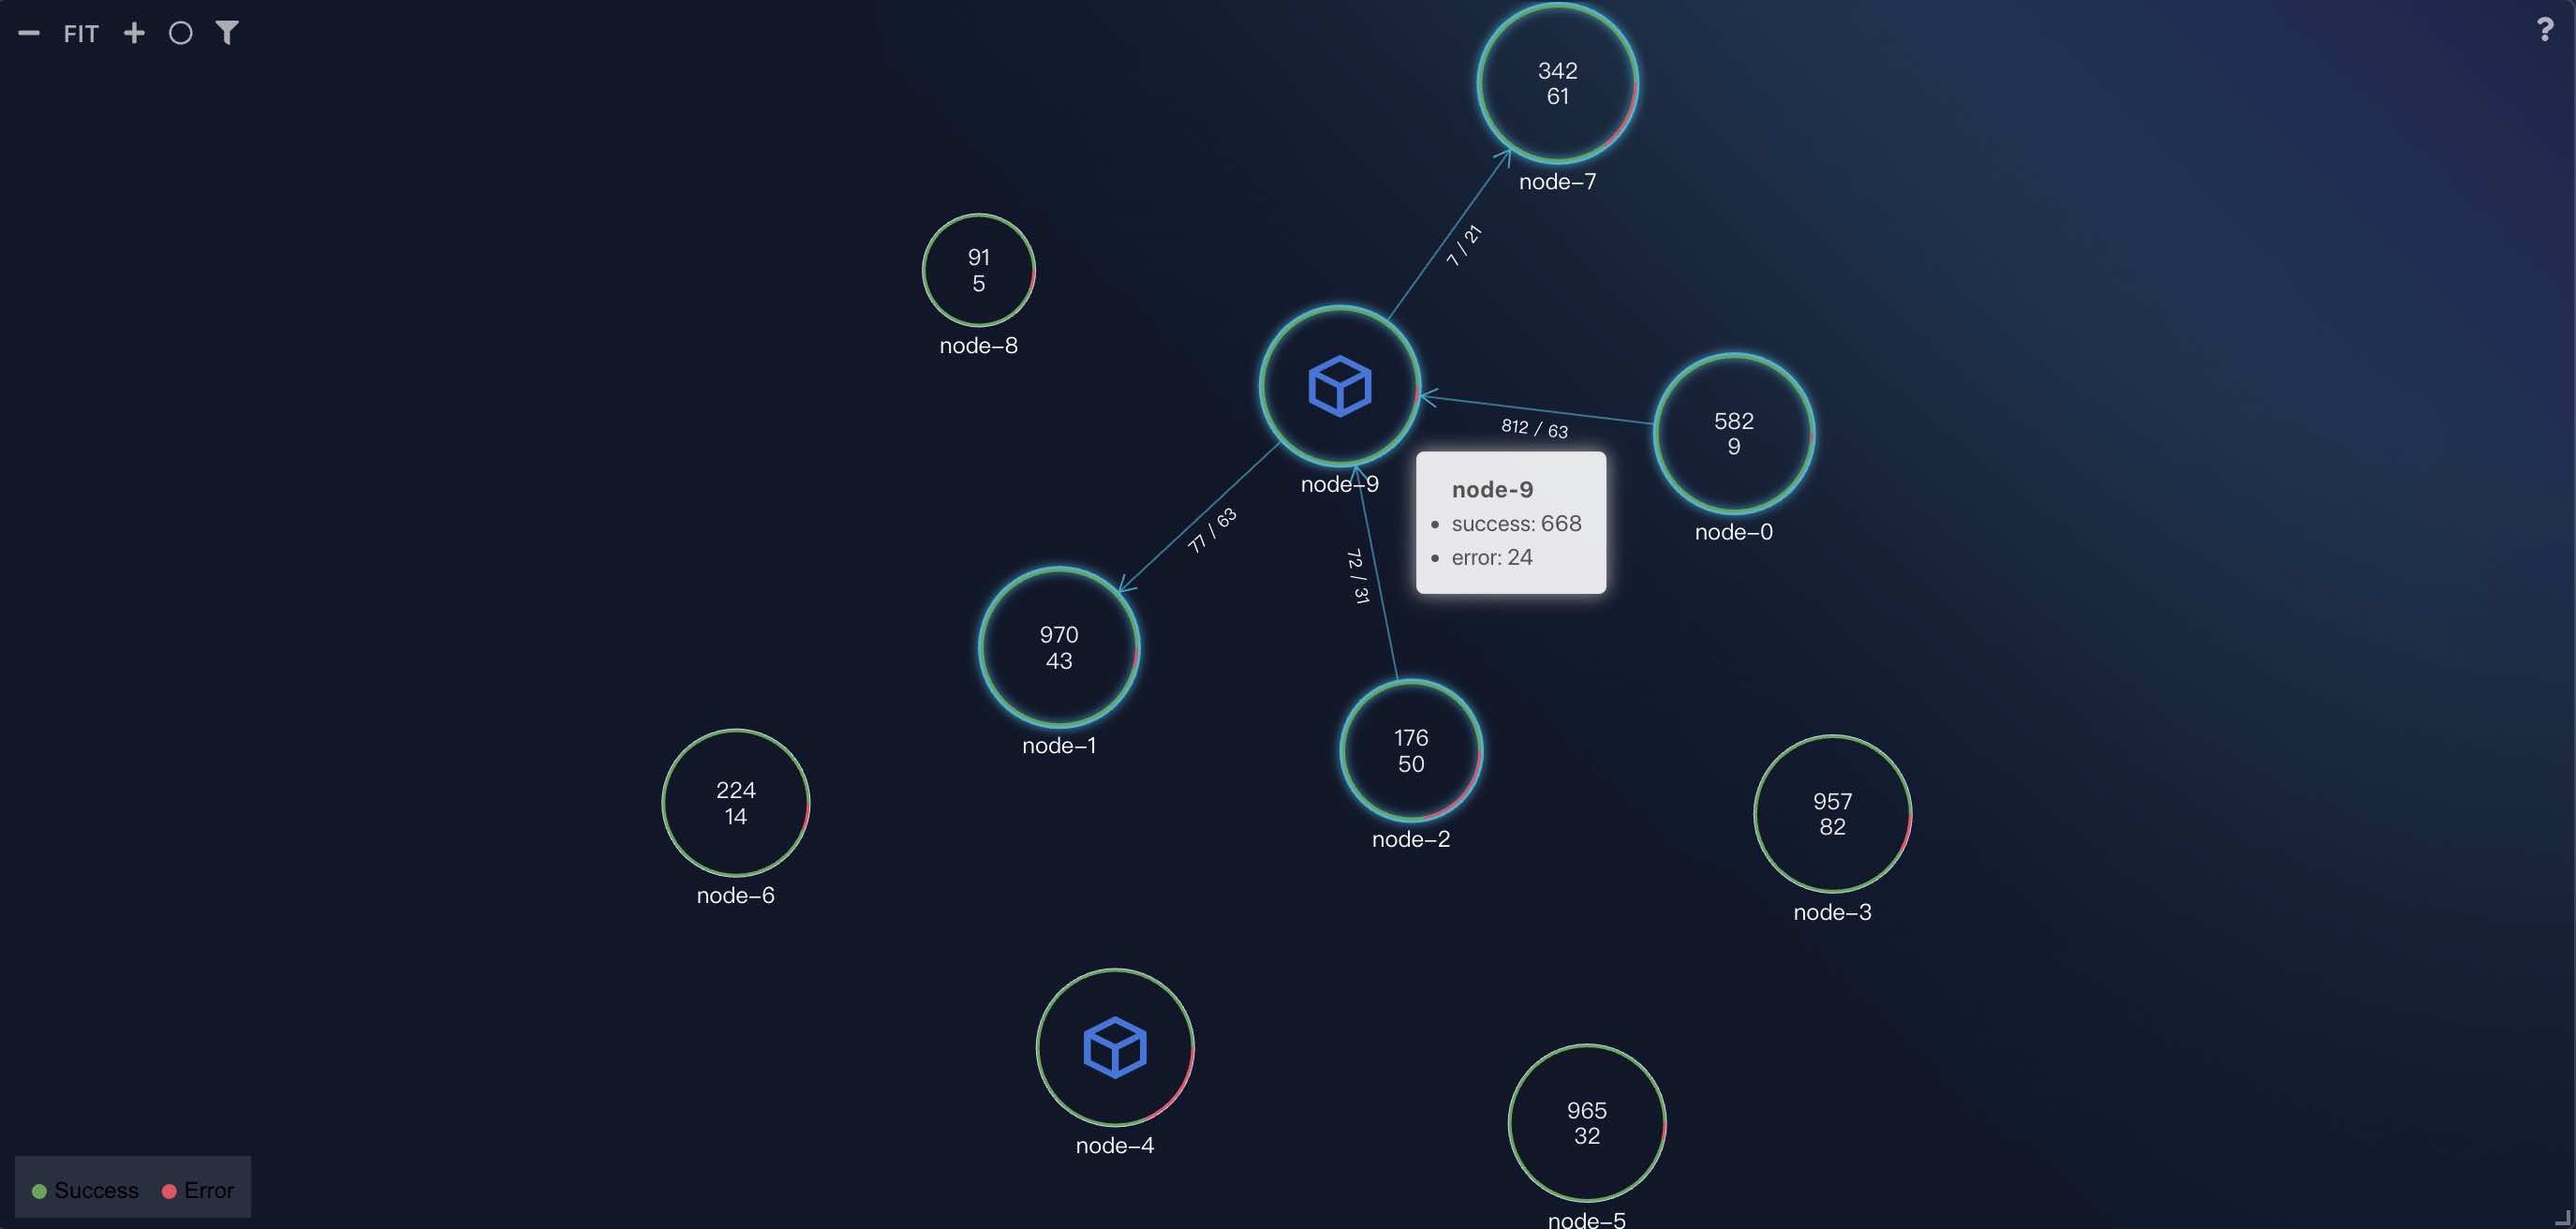
There is a toolbox in the top left corner of NodeGraph, the most useful one is the fitler tool. You can use it to filter the nodes and edges you want.
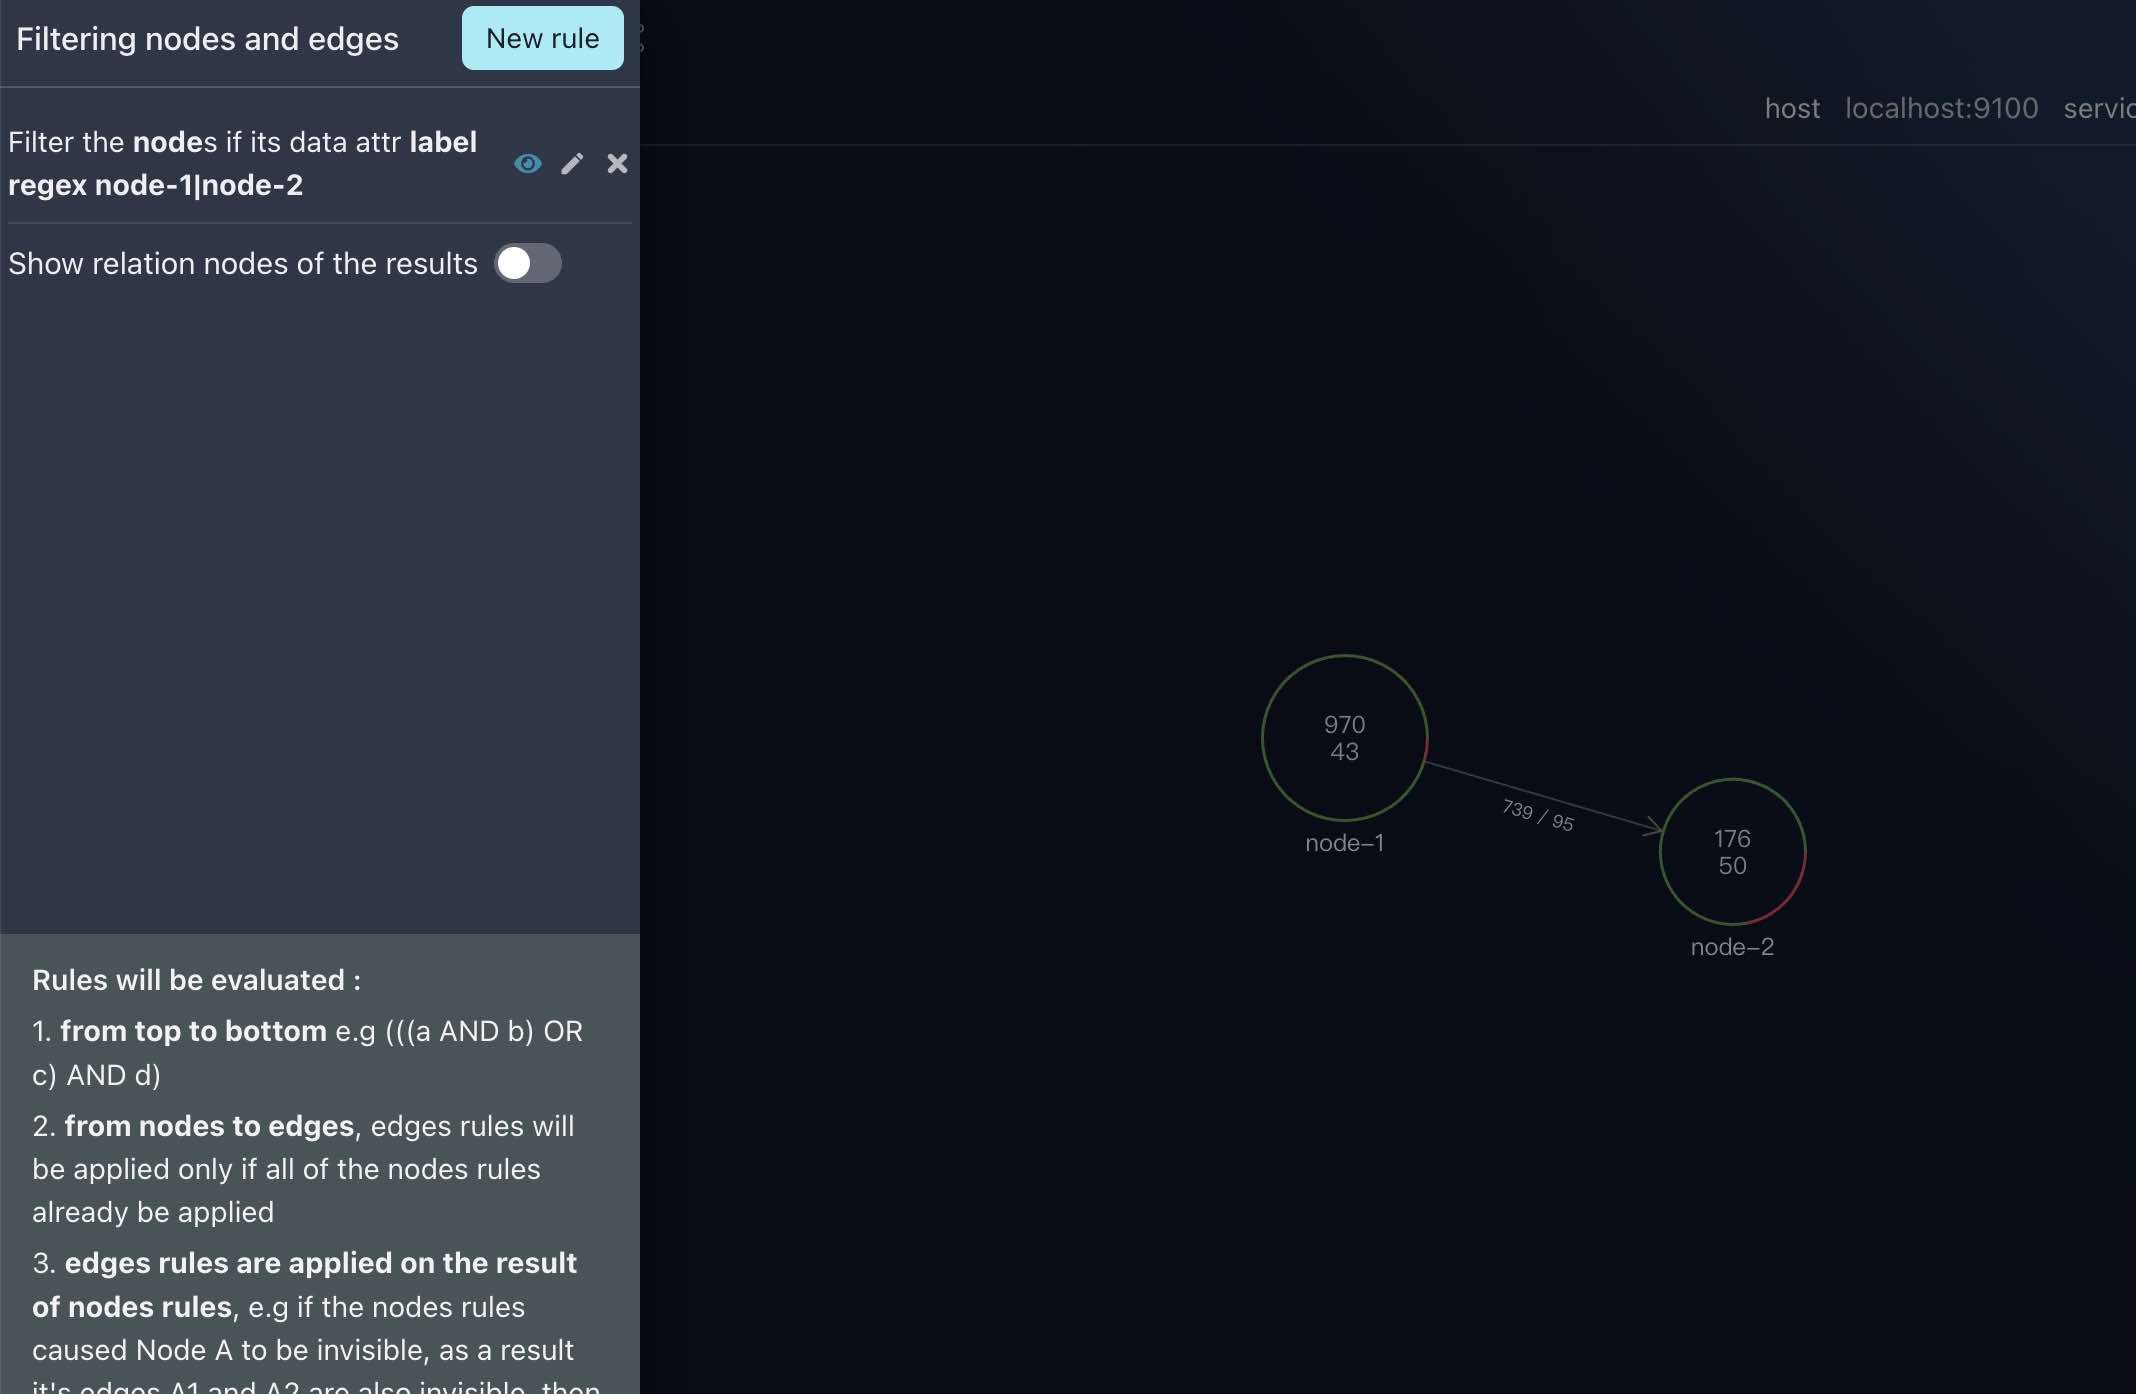
In above image, we set a filter rule to match node-1 and node-2 nodes.
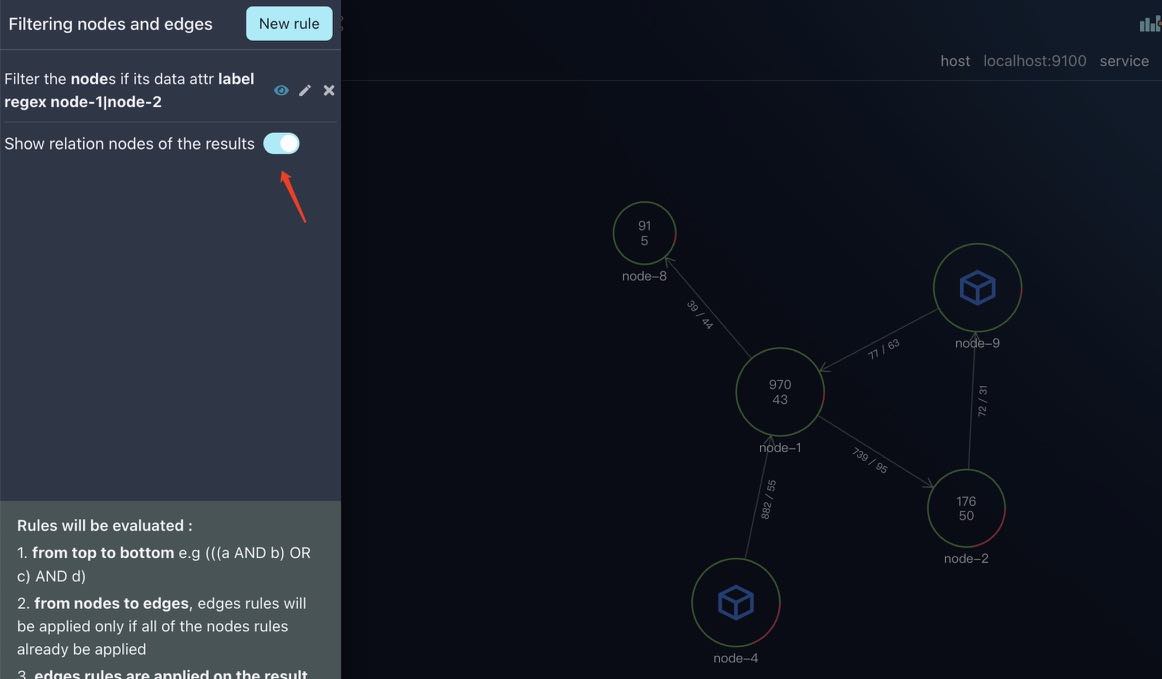
If you want see the relation nodes of them, check Show realtion:
Enable/disalbe
The filter rules you set is automatically store in browser local storage, if you don’t need them, you can remove or just disable them:
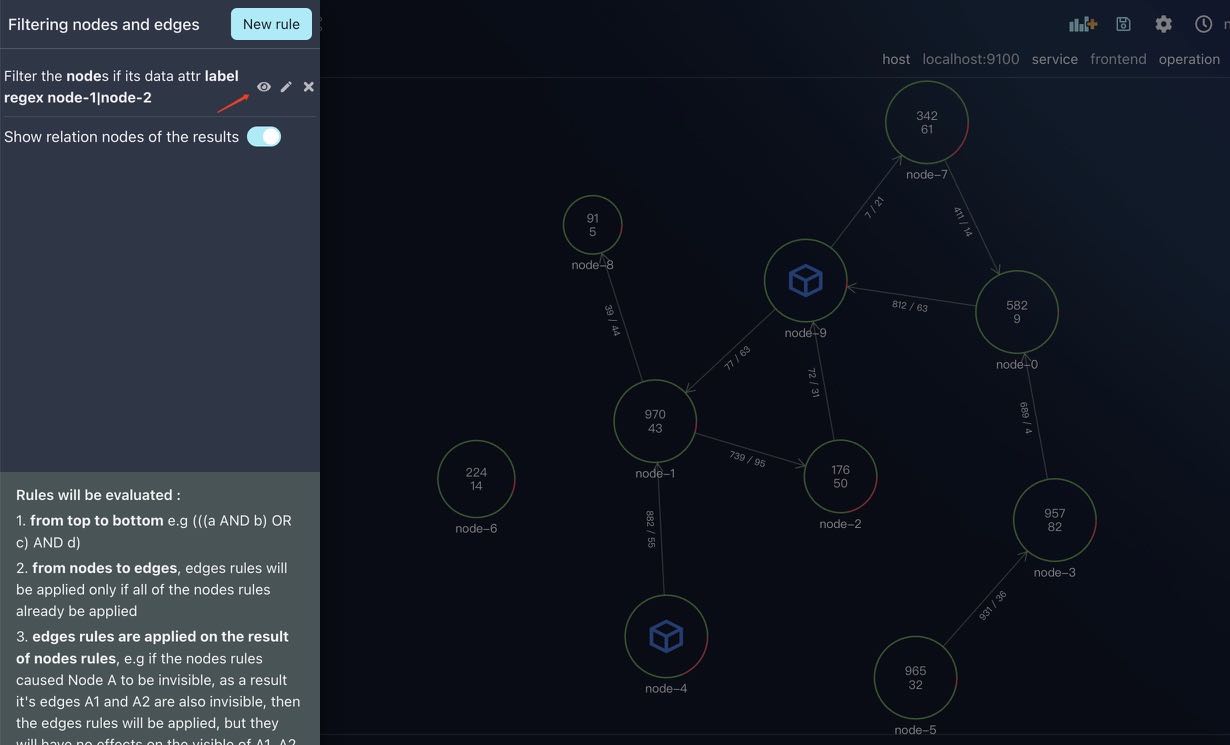
You can see that when we disalbed the rule by clicking the eye icon, all the nodes and edges are shown now.
Donut colors
Nodes in NodeGraph panel are all render in Donut shapes, you can define own colors for them.
Let’s assume your node data format is like this:
"data": {
    "success": 72,
    "error": 28
}
Then you can set donut colors as below:
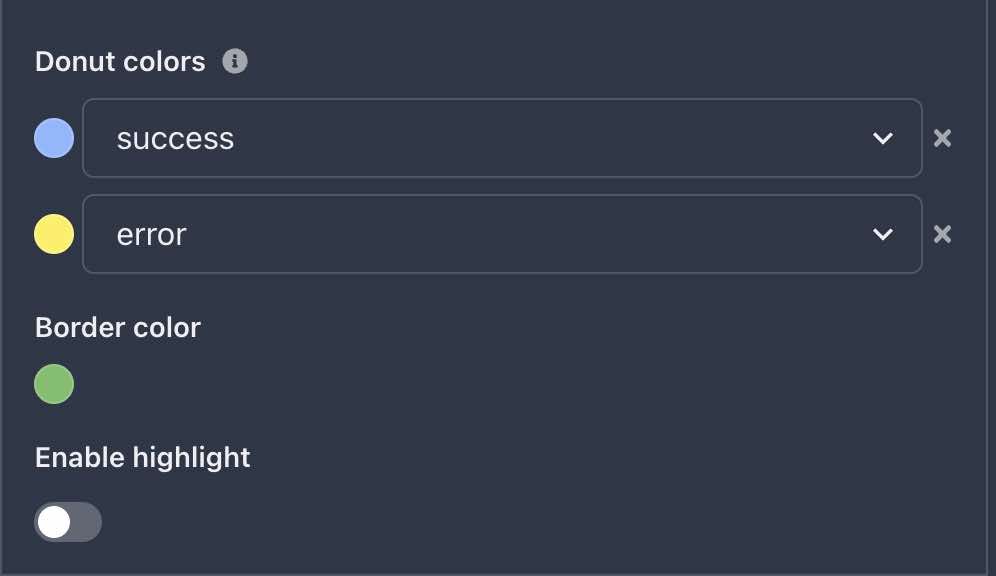
And the result is:
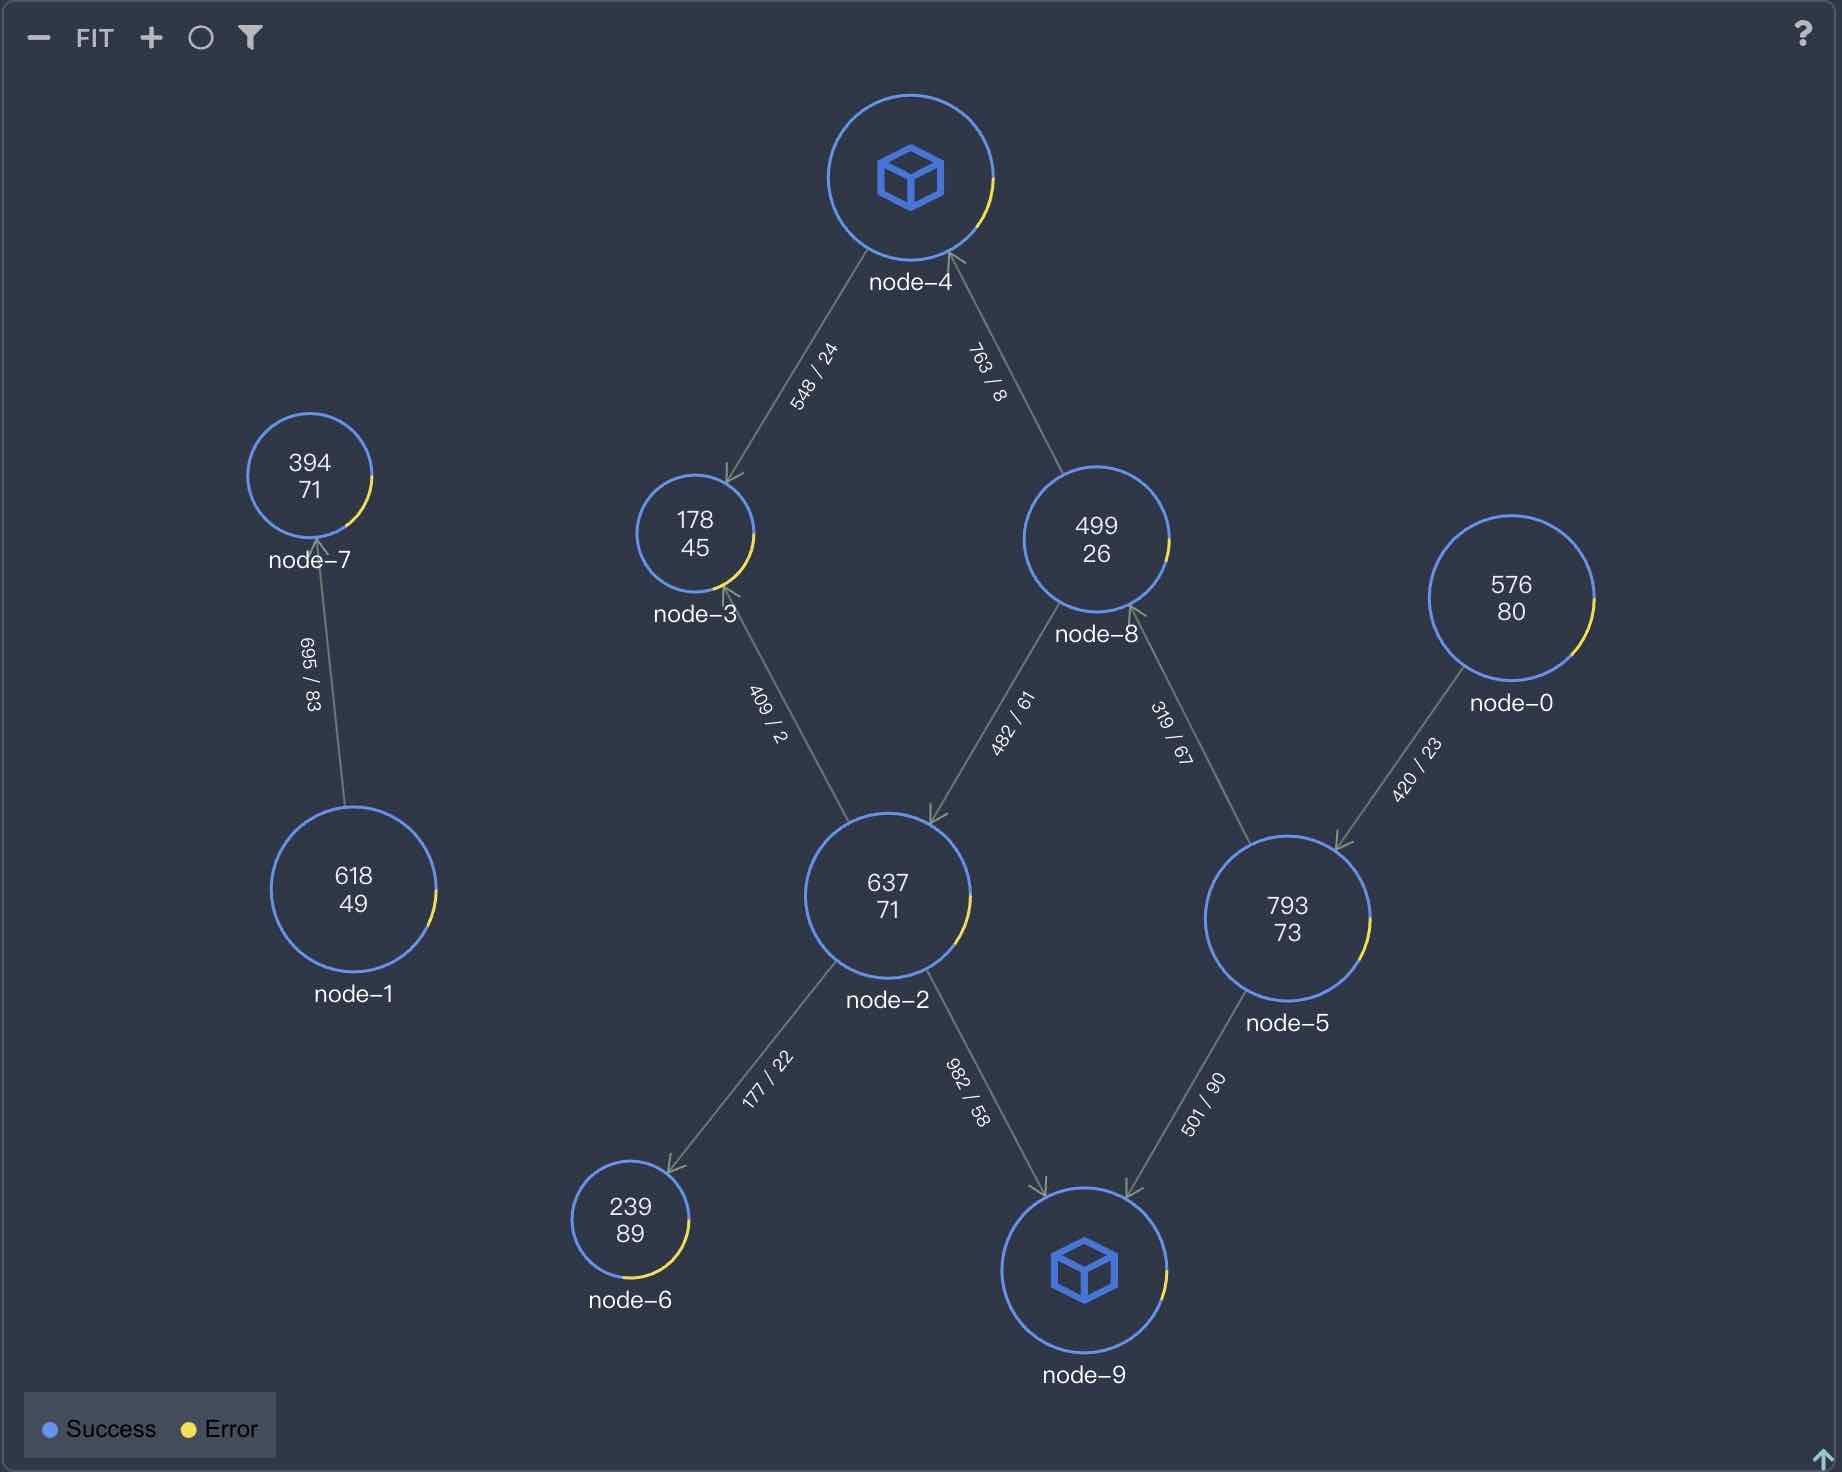
Table View
Sometimes, dependency data in table format is very useful, for how to change view between NodeGraph and Table panel, please refer to Conditional rendering.
Set node size by passing data
User can control the size of node by passing in data with size field in node, for example:
{
    "id": "node-1",
    "label": "Node1",
    "data": {
        "success": 100,
        "error": 10
    },
    "size": 100,
    "show": true,
    "text": "100}\n10"
}
The above JSON is getting through HTTP datasource from one of user services, the size field is used to control the size of node. If you don’t set size field, the node size will be set automatically according to baseSize and maxSize config of NodeGraph.