

- Panel Plugins
- Echarts for general purpose
Panel Plugins
Echarts for general purpose
Apache ECharts is a free, powerful charting and visualization library offering easy ways to add intuitive, interactive, and highly customizable charts to your products。
In xobserve we have wrapped echarts options in a function, so you should feel not hard to use echarts.
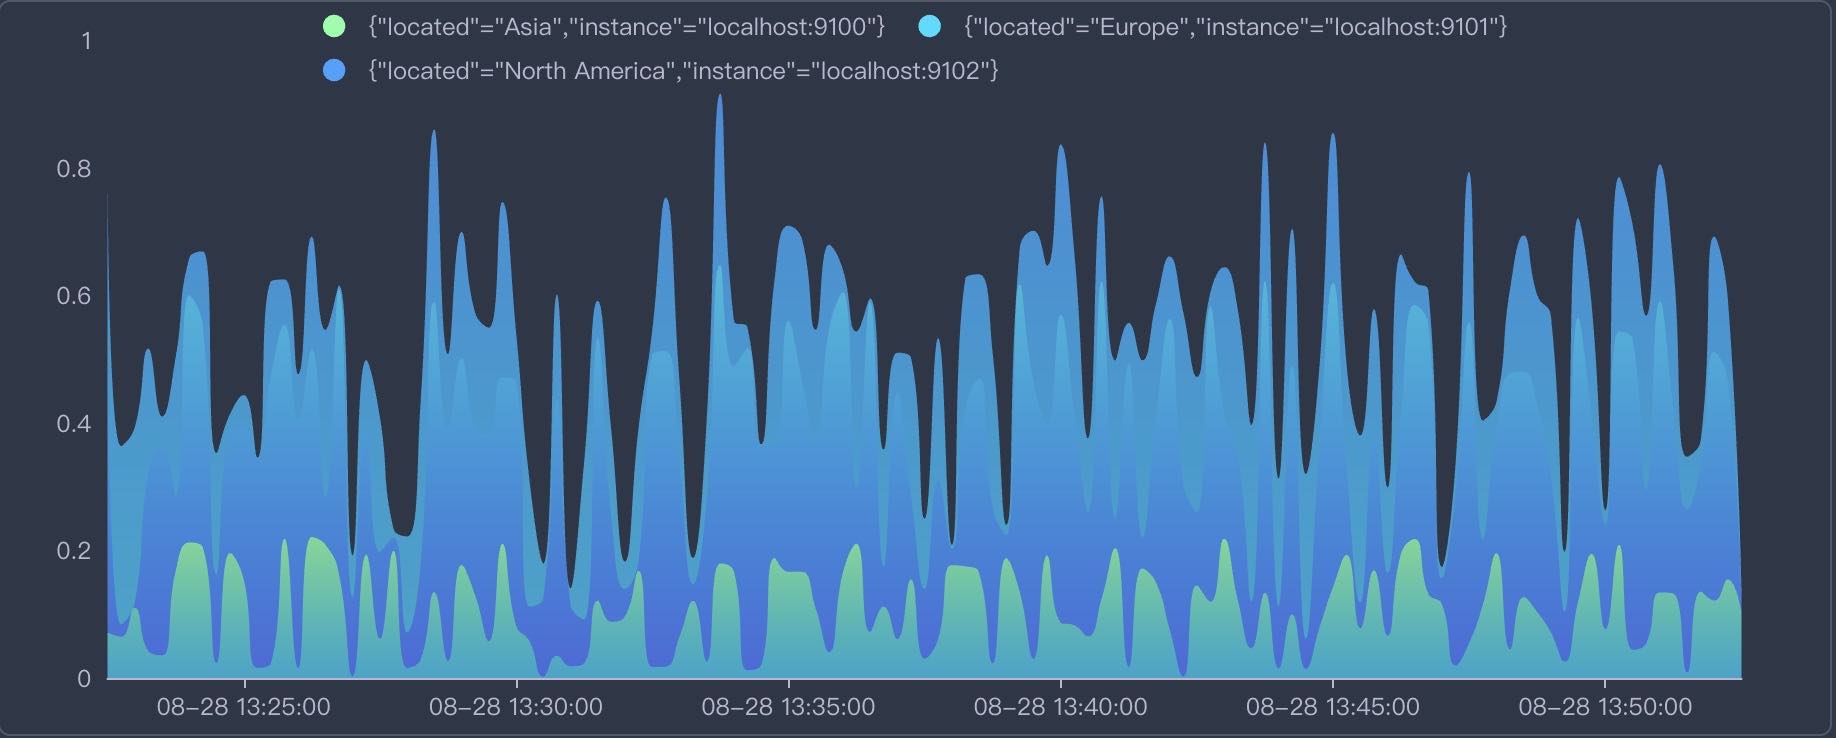
Let’s make a simple chart as above image first.
Echarts settings -> Set echarts options
All we need to do is to set the echarts options based on the passed in data that query from datasource.
Click Edit function and fill in the following code:
// setOptions return echarts.Options, it is directly passed to a echarts chart.
// Find more options examples: https://echarts.apache.org/examples/en/index.html#chart-type-line
// data: SeriesData[] which is the standard data format in xObserve
// thresholds: ThresholdsConfig[] | null
// colors: color palettes using in xObserve
// echarts: imported echarts.js module
// loadash: imported loadash.js module
// moment: imported momen.jst module
// colorMode: "light" | "dark"
function setOptions(data, thresholds, colors, echarts, loadash, moment, colorMode) {
    const colorList = [
        ['rgb(128, 255, 165)', 'rgb(1, 191, 236)'],
        ['rgb(0, 221, 255)', 'rgb(77, 119, 255)'],
        ['rgb(55, 162, 255)', 'rgb(1, 191, 236)'],
        ['rgb(255, 0, 135)', 'rgb(135, 0, 157)'],
        ['rgb(255, 191, 0)', 'rgb(224, 62, 76)'],
    ]

    const legend = []
    const seriesList = []
    if (!echarts) {
        return null
    }

    for (let i = 0; i < data.length; i++) {
        const s = data[i]
        legend.push(s.name)
        seriesList.push({
            name: s.name,
            type: 'line',
            stack: 'Total',
            smooth: true,
            lineStyle: {
                width: 0
            },
            showSymbol: false,
            areaStyle: {
                opacity: 0.8,
                color: new echarts.graphic.LinearGradient(0, 0, 0, 1, [
                    {
                        offset: 0,
                        color: colorList[i] ? colorList[i][0] : colors[i % colors.length]
                    },
                    {
                        offset: 1,
                        color: colorList[i] ? colorList[i][1] : colors[i + 1 % colors.length]
                    }
                ])
            },
            emphasis: {
                focus: 'series'
            },
            data: loadash.zip(...s.fields.map(f => {
                if (f.type == "time") {
                    return f.values.map(v => v * 1000)
                } else {
                    return f.values
                }
            }))
        })
    }

    //!!!ATTENTION!!!
    // We need to create a new options Object to return,
    // because only a new object can trigger react update!
    return {
        color: colorList.map(item => item[0]),
        tooltip: {
            trigger: 'axis',
            axisPointer: {
                type: 'cross',
                label: {
                    backgroundColor: '#6a7985',
                }
            },
        },
        legend: {
            show: true,
            data: legend
        },
        grid: {
            left: '3%',
            right: '4%',
            bottom: '3%',
            top: '5%',
            containLabel: true
        },
        xAxis: [
            {
                type: 'time',
                boundaryGap: false,
                axisLabel: {
                    formatter: (function (value) {
                        return moment(value).format('MM-DD HH:mm:ss');
                    }),
                },
                splitNumber: 5,
            }
        ],
        yAxis: [
            {
                type: 'value',
                splitLine: {
                    show: false
                }
            }
        ],
        series: seriesList
    }
}
In above code, we have done these things:
- 1. Transform the passed in data of type
SeriesDatato the format that Echarts needs. - 2. Return the options that will pass to Echarts instance.
In a word, xObserve:
- Query data of
SeriesDatatype from datasource, such as Prometheus. - This data is passed into
setOptionsfunction, - The function transform
SeriesDatato the format that Echarts needs - Return an options object and pass it to Echarts instance to render the chart.
Interactions
We can add interactions to echarts chart, such as click event:
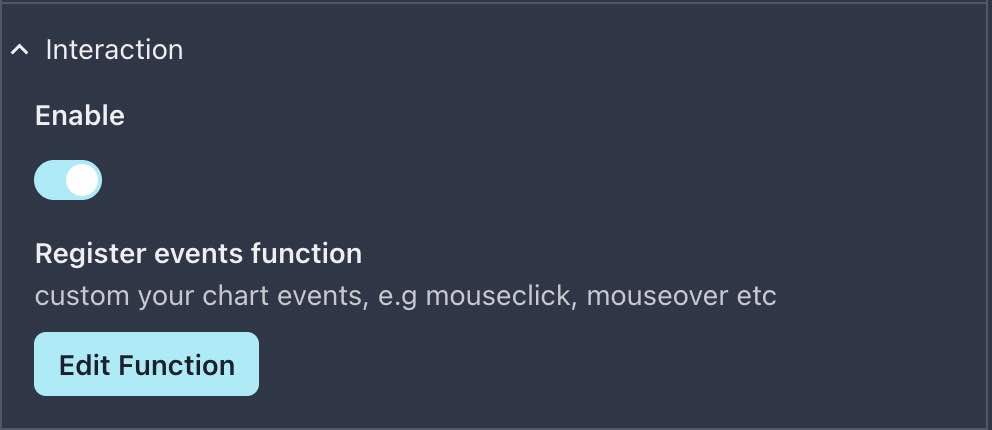
Then click Edit function, for now , you should see a default function body as below:
// In registerEvents, you can custom events on your chart, e.g mouse click event, mouse over event etc.
// chart: a instance of echarts, you can call echarts apis on it
// options: result of setOptions function
// Find more examples: https://echarts.apache.org/en/api.html#events
function registerEvents(options, chart, navigate, setVariable, setDateTime, $variables) {
    // !!!!!!!ATTENTION! You must unbind event handler first!
    // Because each time the options changeds registerEvents function will be called once
    // If we don't unbind event, next time you click the chart will trigger N  click event ( N = Number of times the options changes)
    // Rather than unbind all 'click' events, you can also unbind an specific handler: https://echarts.apache.org/en/api.html#echartsInstance.off
    chart.off('click')
    chart.on('click', function (params) {
        console.log(params)
    })
}
Oh, nice, xObserve already define a basic click event for us, let’s try to click che chart and see what will happen.
As shown above, we click on a point of the chart and then call console.log to write something to the browser console.
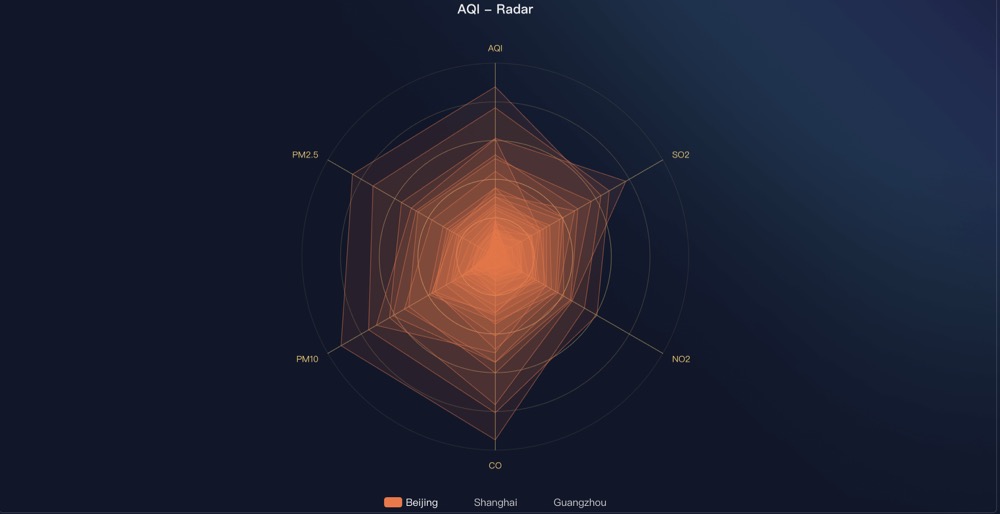
More examples
Here are more examples for Echarts.
All echarts demos can be found here
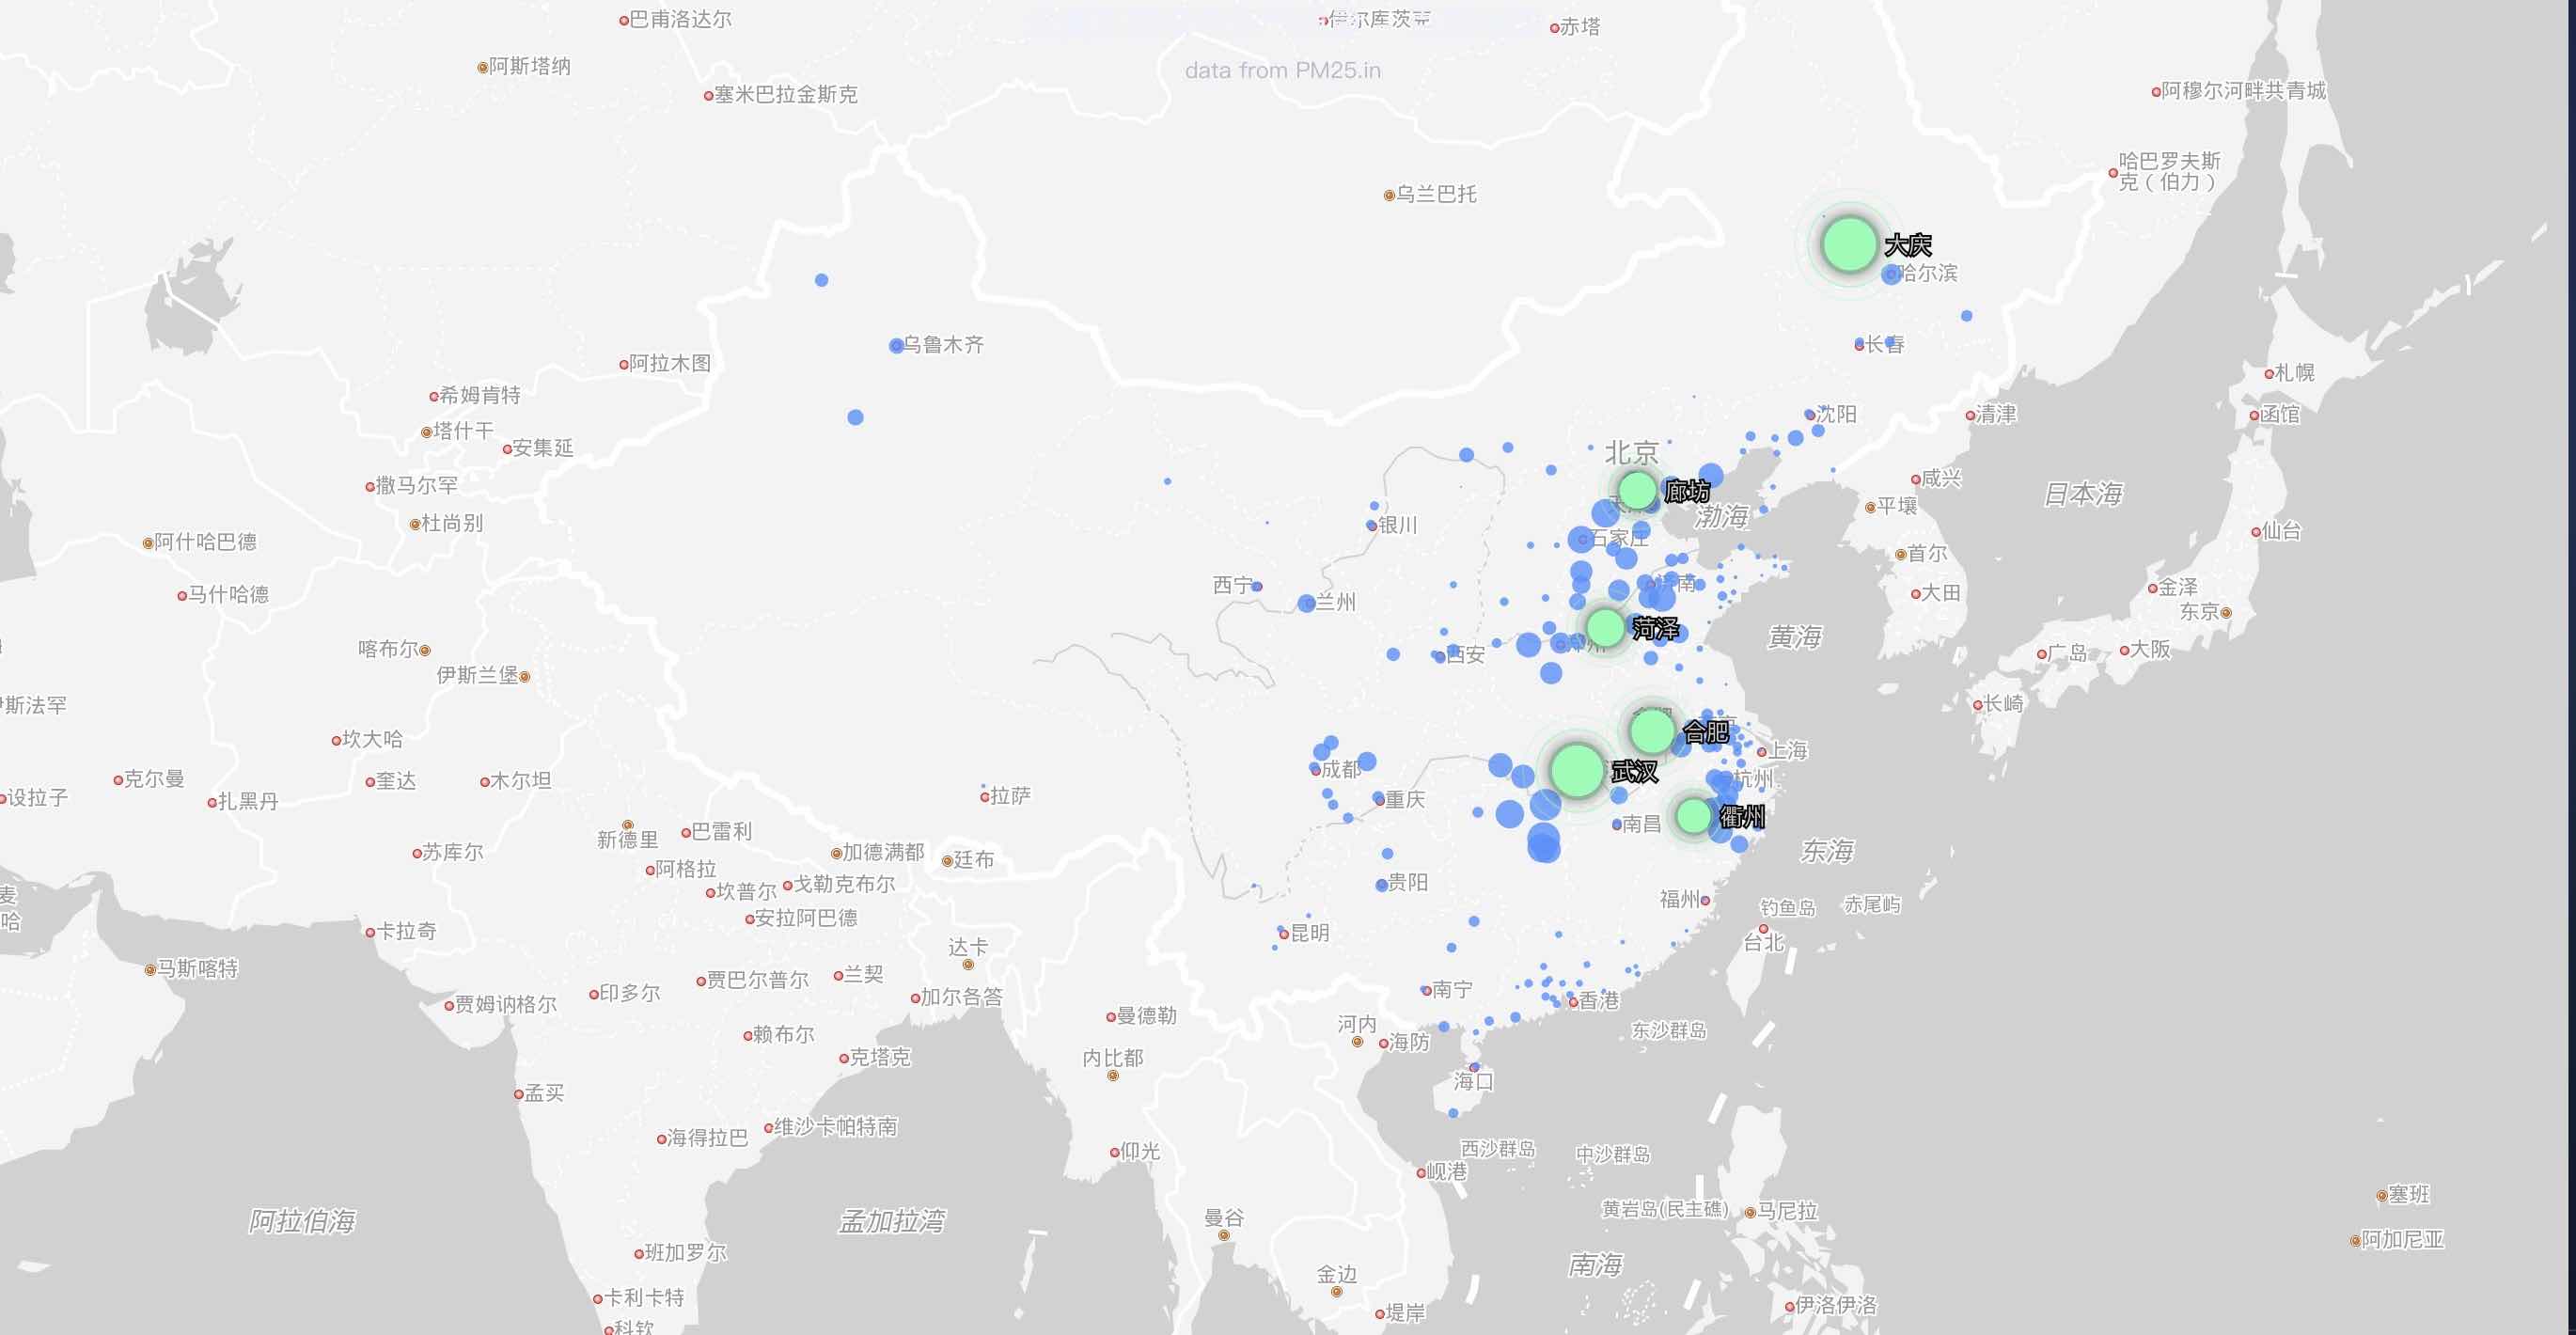
Baidu map
Baidu map is a special plugin for Echarts, so you need to do some configuration to use it:
- Enable
Baidu mapsdk inxobserve.conffile
panel:
  echarts:
    enable_baidu_map: true
baidu_map_ak: 'AK for Baidu map, apply from https://lbsyun.baidu.com/apiconsole/key#/home'- edit
setOptionfunction, and copy in the source code from Github gist