
- Panel Plugins
- Geo Map
Panel Plugins
Geo Map
Geo Map is a plugin that can render data points at specific locations on a map, including country codes, city names and coordinates.
You can find country codes, city names at here
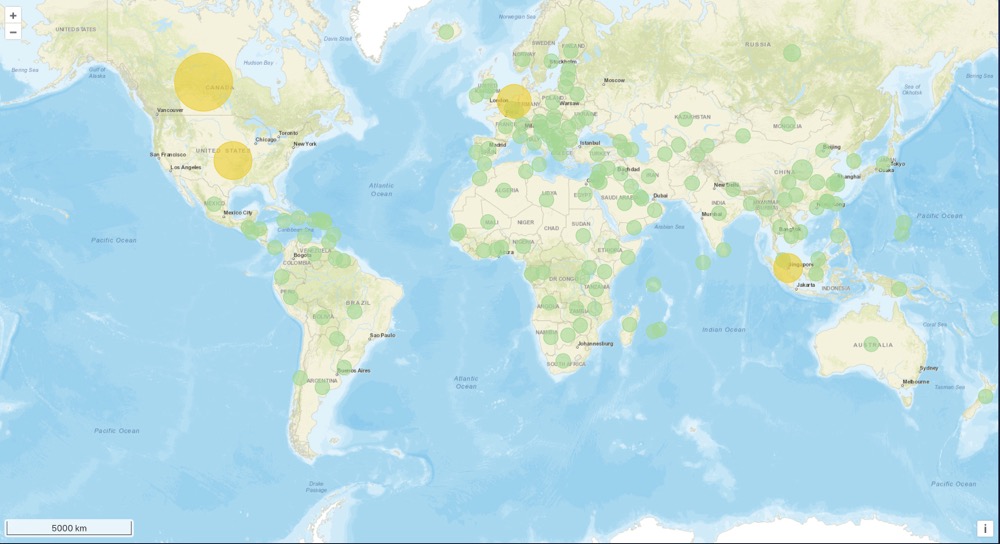
World countries and cities
Render countries and cities on a world map:
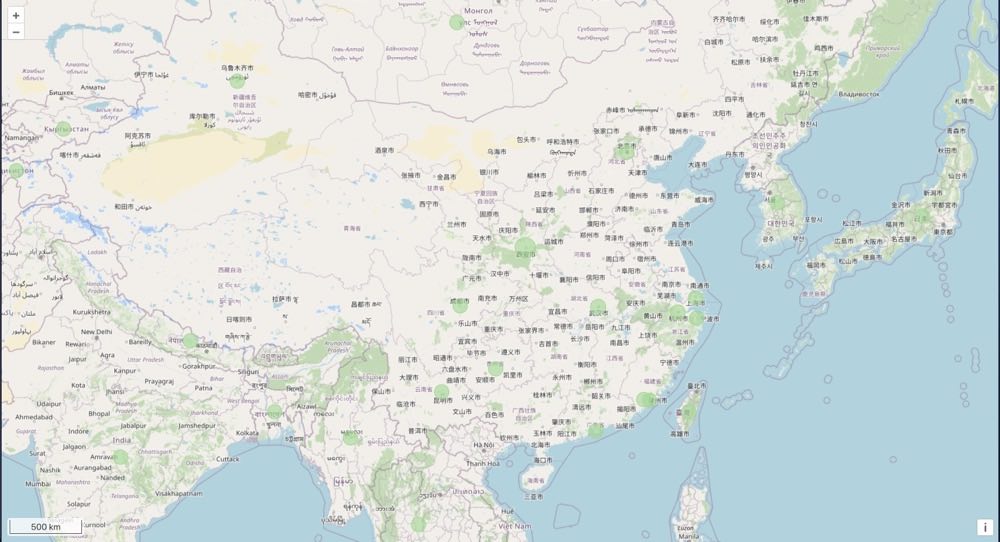
China cities
Render cities on China map:
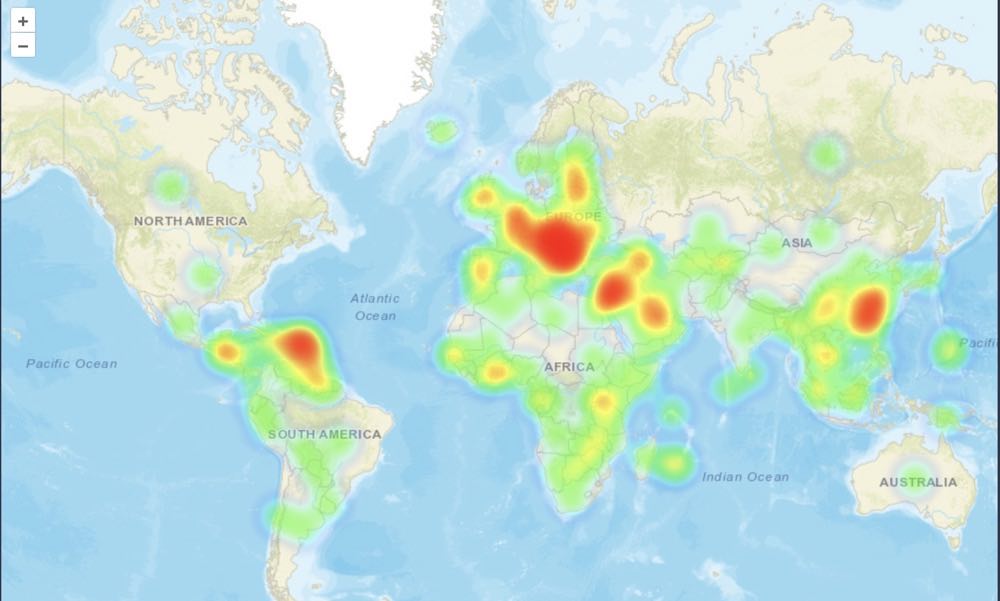
Heat map type
Interactions
You can define click events for data points on map:
// map:  openlayer map <https://openlayers.org/en/latest/apidoc/module-ol_Map-Map.html>
// setVariable: (varName:string, varValue:string) => void
// navigate: react-router-dom -> useNavigate() -> navigate
// setDateTime: (from: Timestamp, to: TimeStamp) => void

function onClick(data, map, navigate, setVariable, setDateTime, $variables) {
    // You can get all current variables in this way
    const coords = data[0].getGeometry().flatCoordinates
    const view = map.getView()
    view.setCenter(coords)
    view.setZoom(10)
}
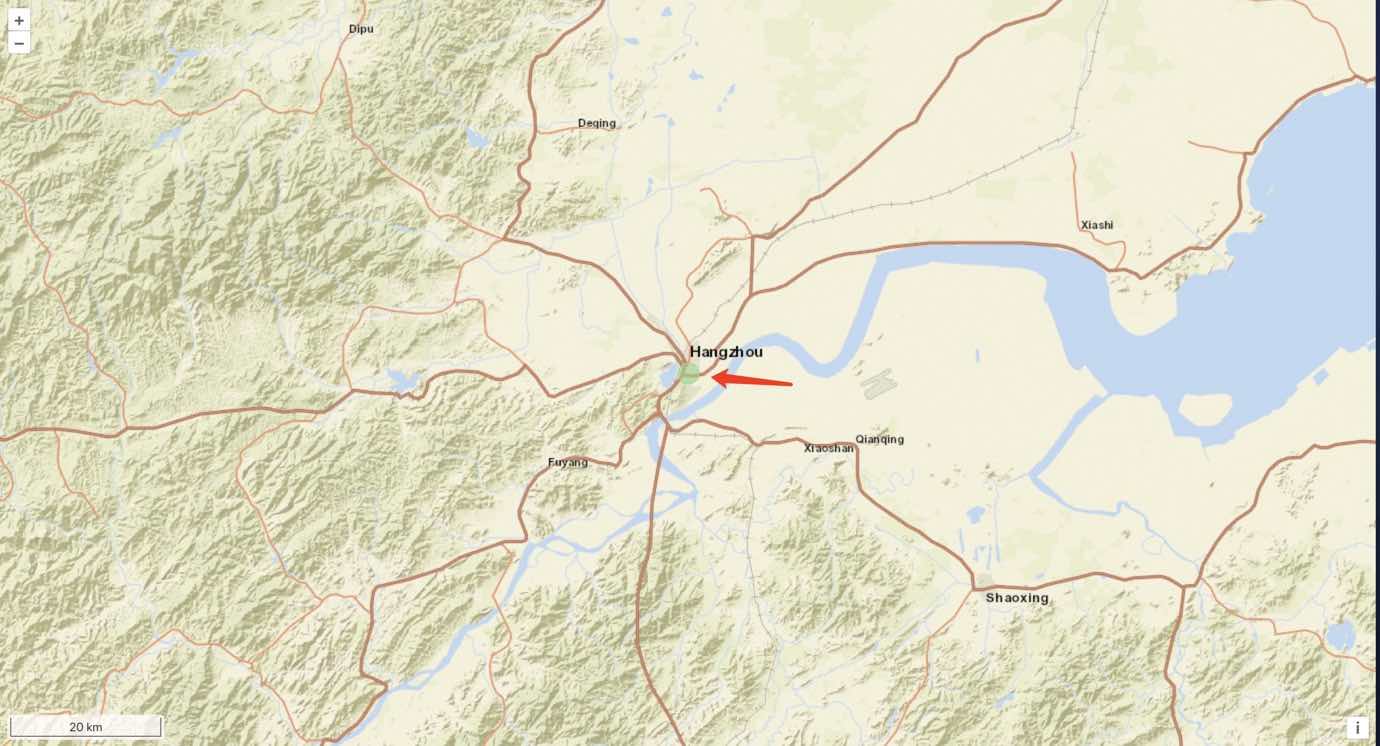
Triggering this event will cause the map to zoom in and center the clicked point: if you click on Hangzhou city in China, the map will be zoomed in and centered on Hangzhou:
Thresholds
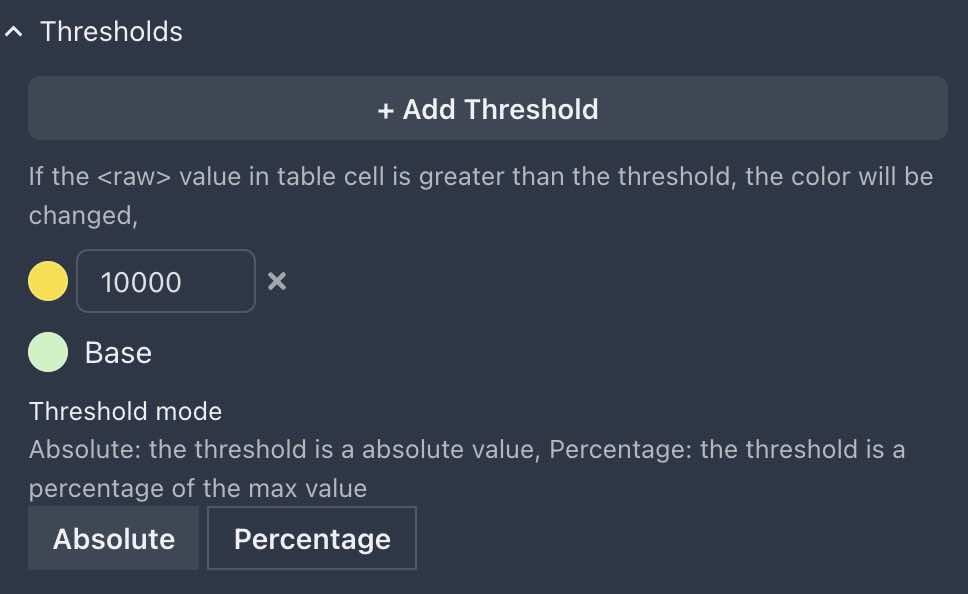
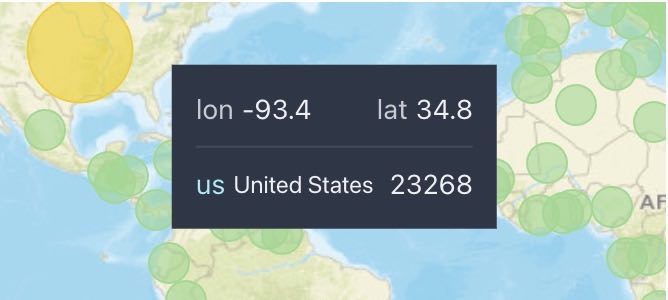
When the value of data points is larger than a threshold value, the data point will render in a different color that defines by threshold:
Data format
You should read this doc first and already know what is
Final data format。
If you want to render data points on map, you must understand what data format Geomap requires, then you can transform the incoming data into the required format.
Select TestData datasource and Geomap visualization, then open Panel Debug -> Panel Data, you should see below final data format that geomap requires:
[
  [
    {
      "name": "US",
      "fields": [
        {
          "name": "Time",
          "type": "time",
          "values": [
            1690416000000,
            1690502400000,
            1690588800000
          ]
        },
        {
          "name": "Value",
          "type": "number",
          "values": [
            27379,
            22114,
            23268
          ]
        }
      ]
    },
    {
      "name": "Shanghai",
      "fields": [
        {
          "name": "Time",
          "type": "time",
          "values": [
            1690416000000,
            1690502400000,
            1690588800000
          ]
        },
        {
          "name": "Value",
          "type": "number",
          "values": [
            39,
            22,
            16
          ]
        }
      ]
    },
    {
      "name": "Bei_jing",
      "fields": [
        {
          "name": "Time",
          "type": "time",
          "values": [
            1690416000000,
            1690502400000,
            1690588800000
          ]
        },
        {
          "name": "Value",
          "type": "number",
          "values": [
            4,
            1,
            4
          ]
        },
        {
          "name": "Geo",
          "type": "geo",
          "values": [
            116.4,
            39.9
          ]
        }
      ]
    }
  ]
]
Here are three data points on the map: US is the country code for United States, Shanghai is a city name in China, Bei_jing is also a city name in China.
The difference between Shanghai and Bei_jing is that Bei_jing has a coordinates in its field data:
{
    "name": "Geo",
    "type": "geo",
    "values": [
        116.4, // longitude
        39.9 // latitude
    ]
}
The three points can be divide into three types:
- Country code
US, defined in countries.json - City names
Shanghai, defined in cities.json - Coordinates, passed by field with “type”:“geo”
xObserve lookup the coordinates of points first by country code, then by city name, and finally by coordinates.
In fact, the Time field in data point is never used, why it is exist is just because data format of Geomap is acutally the same as Graph and Table: SeriesData format.
Therefore if you get data from a HTTP API, or transform data into Geomap format, you can ignore the Time field:
{
    "name": "US",
    "fields": [
    {
        "name": "Value",
        "type": "number",
        "values": [
            27379,
        ]
    }
    ]
},
The above data format is the standard format for render a data point on Geomap.

