

- Tutorials
- Query alerts, correlate to Graph
Tutorials
Query alerts, correlate to Graph
You can’t configure alerts rules in xObserve, because we believe: leave professional work to professional people.
In you use Prometheus, you can create alerts rules in Prometheus, if you have your own APM services, you can create alerts in these systems.
xObserve is mainly focus on Alert dispaly. There are two ways to display alerts in xObserve:
- Viewing alerts in alert page
- Correlate alerts to centain panel
They have different use cases, let’s talk about them one by one.
Alert dashboard
There are two special dashboards predefined in xObserve, they have their own special ids.
- Home dashboard with id
d-home - Alert dashboard with id
d-alert
Specially, the alert dashboard also has a predefined url path : /alert.
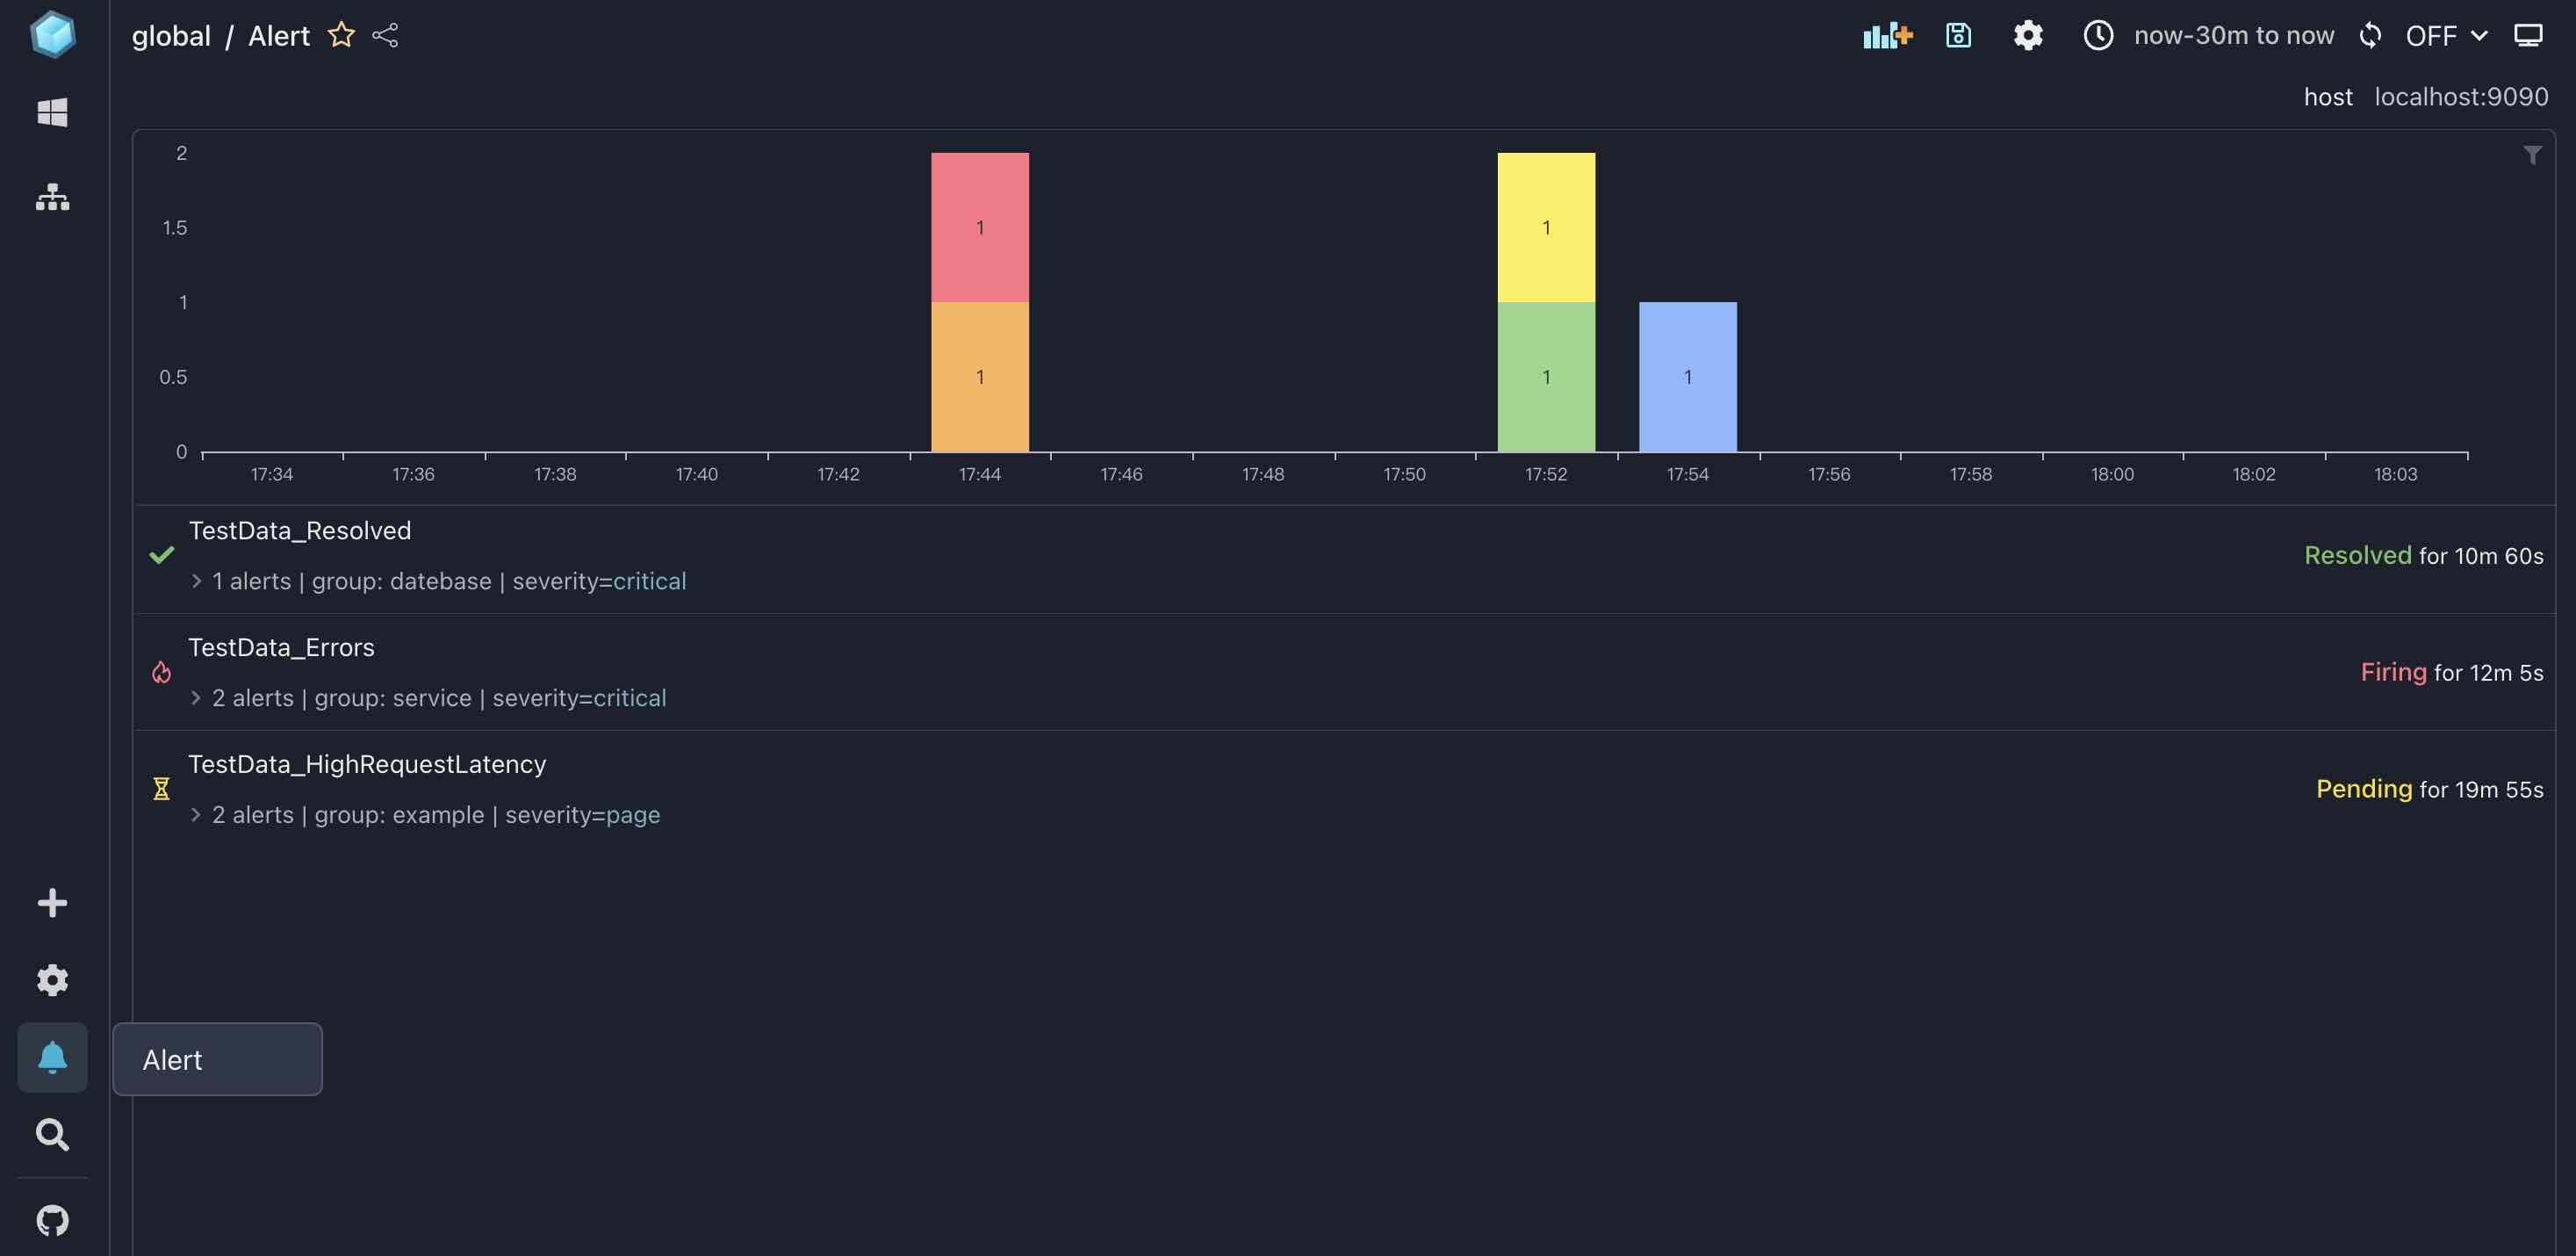
You can visit alert dashboard by clicking the alert icon in sidebar, or visit http://localhost:5173/alert url directly.
Now let’s assume you are already in alert dashboard page, you will see a list of alerts in this page.
Maybe you would wonder: why there are so many alerts here? I didn’t create any alerts in xObserve. The answer is simple: the alerts you see are all from TestData datasource.
Add alerts rules in Prometheus
TestData is useful, but they are also useless. To make it usefull, we should query the real alerts.
Because Prometheus is the core datasource of xObserve, we will use it here to show how to add alerts to xObserve.
First, let’s create some alert rules in Promtheus.
At the moment, we can only create alert rules through the config file of Prometheus, there are no plans for configure theme through web api :(
But don’t worry, it’s easy to use, and compare to web api, this way can reduce much unnecessary alert rules.
Find the promtheus.yml config file in your prometheus install directory (maybe you have other config file name or install path).
Add such content to this file:
# Load rules once and periodically evaluate them according to the global 'evaluation_interval'.
rule_files:
  - "first_rules.yml"
  # - "second_rules.yml"
We only need to define the rule files here, the concrete alert rules are defined in first_rules.yml.
Then create a new file named first_rules.yml along side prometheus.yml, and fill in below content:
groups:
- name: example
  rules:
  - alert: HighRequestLatency
    expr: go_gc_duration_seconds_count > 20
    for: 2m
    labels:
      severity: page
    annotations:
      summary: High request latency
You can see our alert rule has no sense: when value of go_gc_duration_seconds_count is larger than 20 and last for 2 minutes, promtheus will throw out an alert.
Why we said it is no sense is because this is a Counter metrics, it will surely be larger than 20 in a short time after you start Prometheus server which will ensurely trigger the alert rules, therefore we can easily view the alerts in xObserve.
After configuration, start Prometheus server and go back to our xObserve ui.
For more information, please visit Prometheus website, xObserve does not dependent on Prometheus, we just query alerts from it, how the alerts is configured and fired, it is all the responsibility of Prometheus
Query alerts from prometheus
Because we already set up a prometheus datasource, we can directly query from it, there is no need to write any queries.
All we need to do is :
- Visit /alert page and open its panel editor
- Find
Alert Filtersection inPanel tabin panel editor, this section is used for filter the alerts that are querying from given datasources.
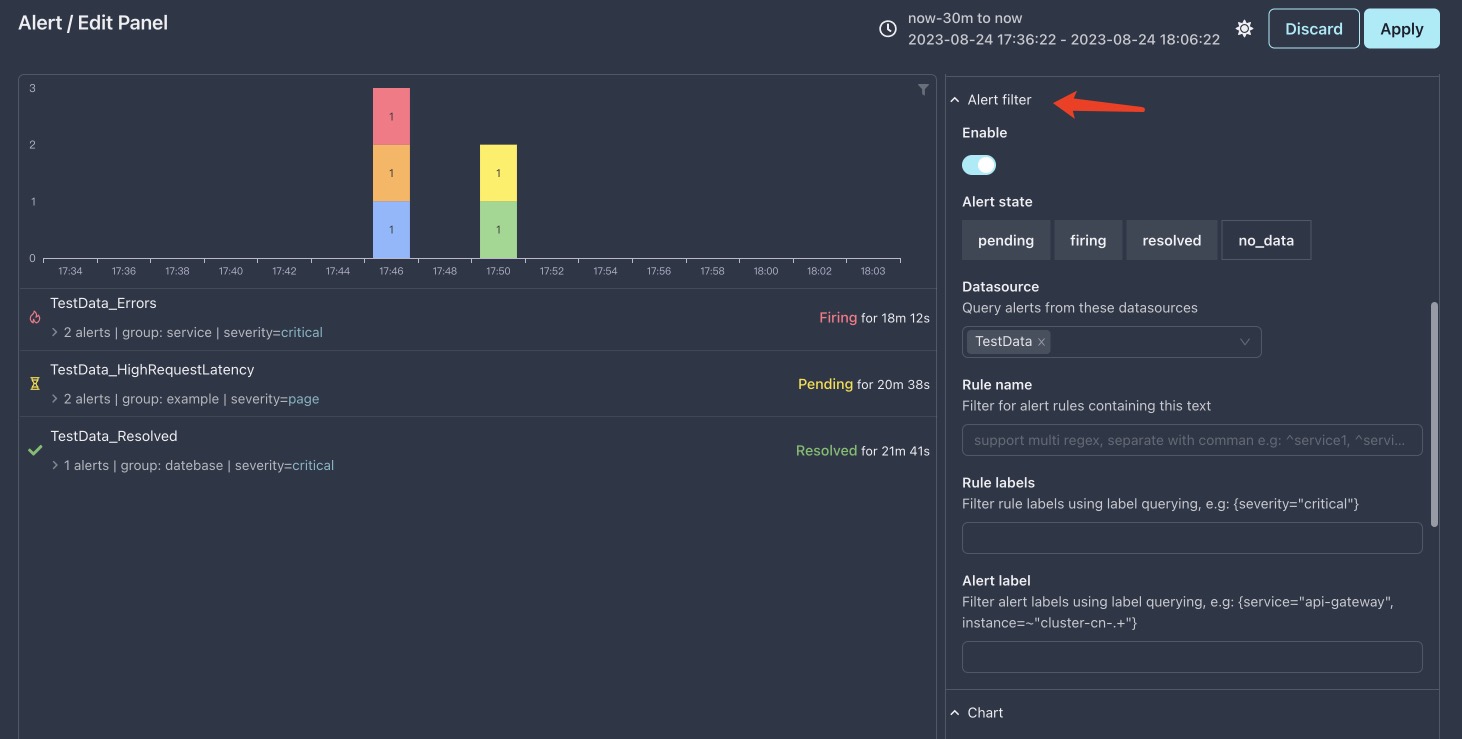
- Add
prometheusdatasource toDatasourcefilter, and removeTestDatadatasource.
You should see the reult as below:
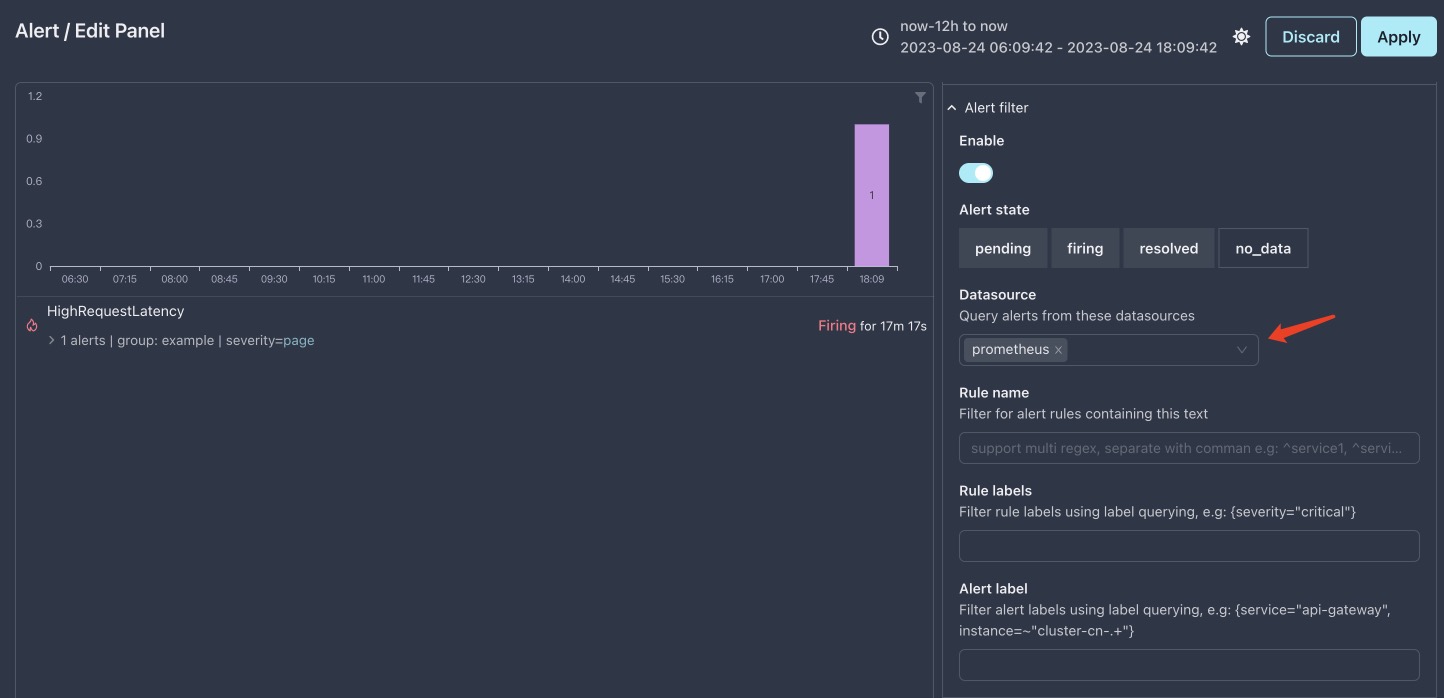
Here we successfully query the real alerts from Prometheus, let’s have a deep view into this alert rule.
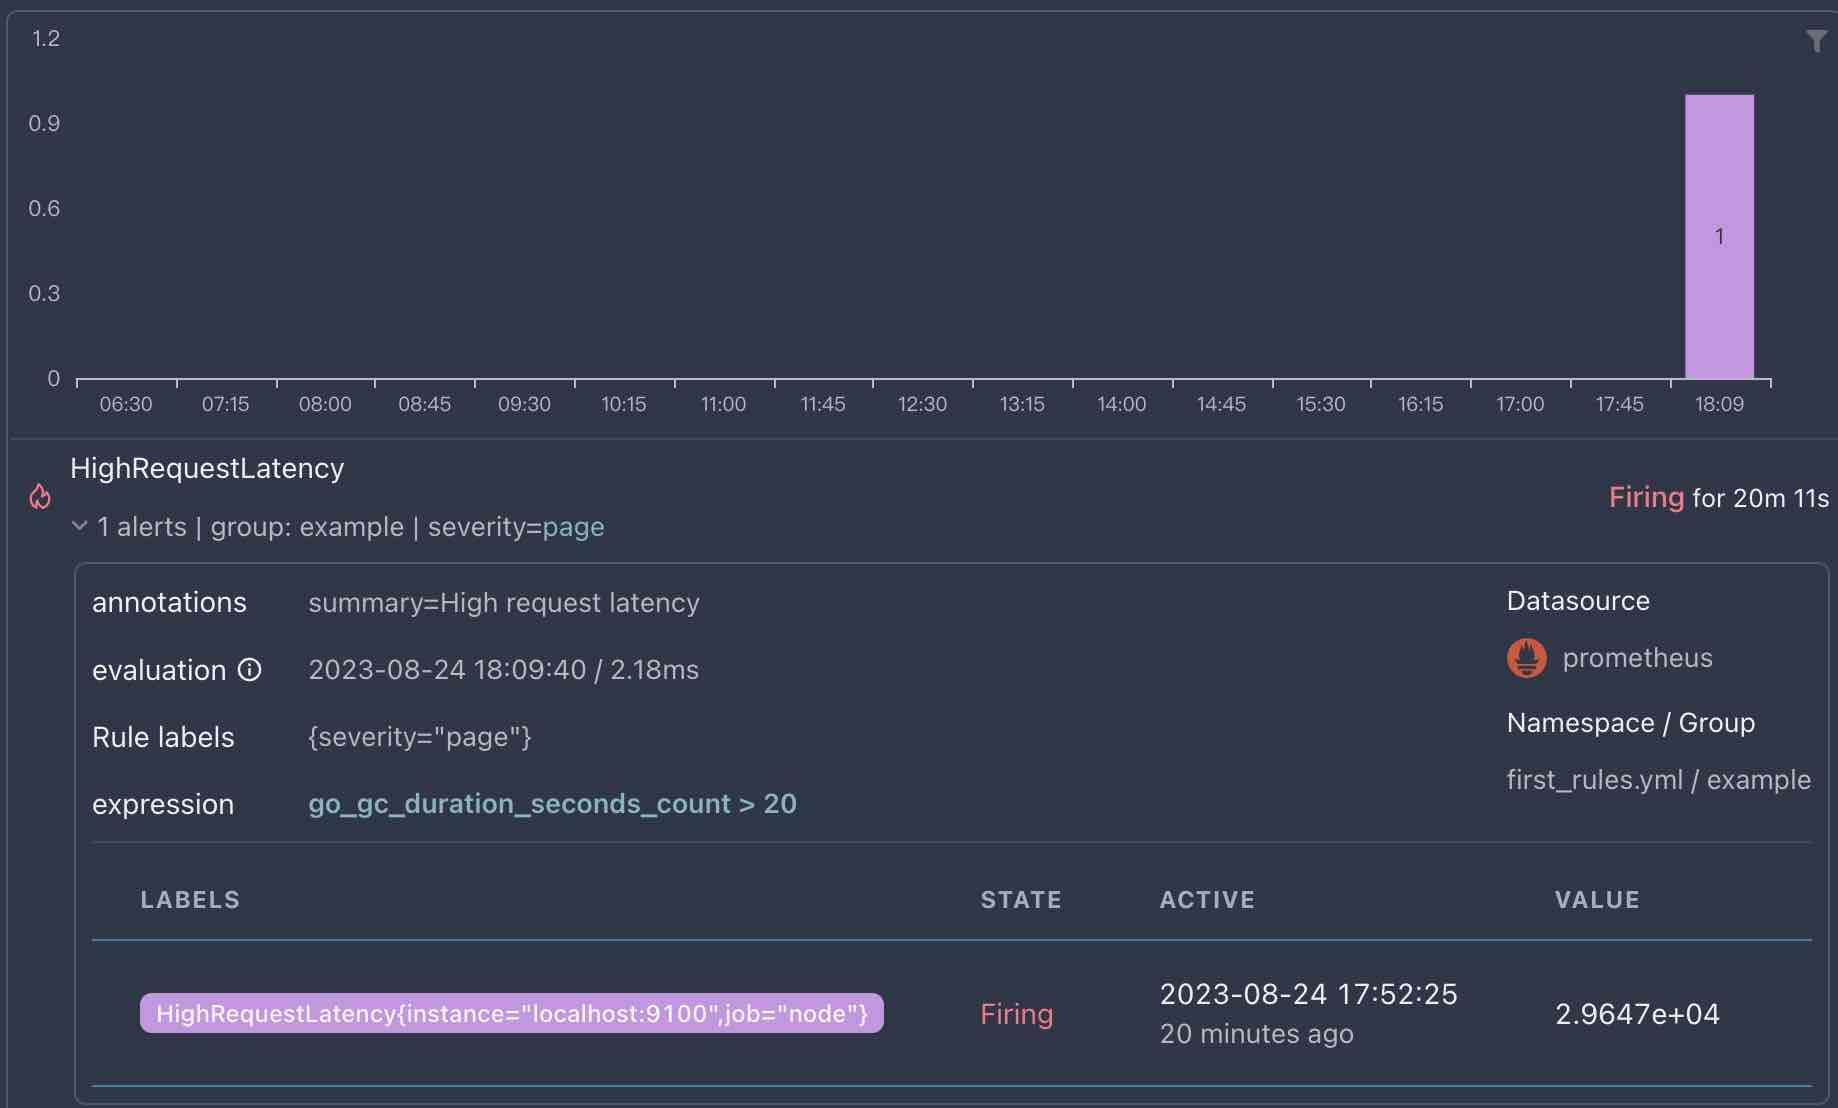
You can compre alert info to the alert rule defined in prometheus config files. For more info please visit Alert settings.
When to use
Alert page is designed for general purpose using: when you want view all alerts happened in your system, and want explore them, you can visit /alert page.
Correlate alerts to Graph panel
You can also correlate some alerts to Graph panel, this will show marks on Graph panel to provide more clear info about alerts time point and status.
Let’s create a panel in Home dashboard, because alerts graph is usually place in home dashboard.
Switch sidebar to global team
Click user icon at bottom of sidebar, then hover on Select Sidemenu item and select Global team’s sidemenu.
When sidebar is switched, you should see Home dashboard at the top of sidebar.
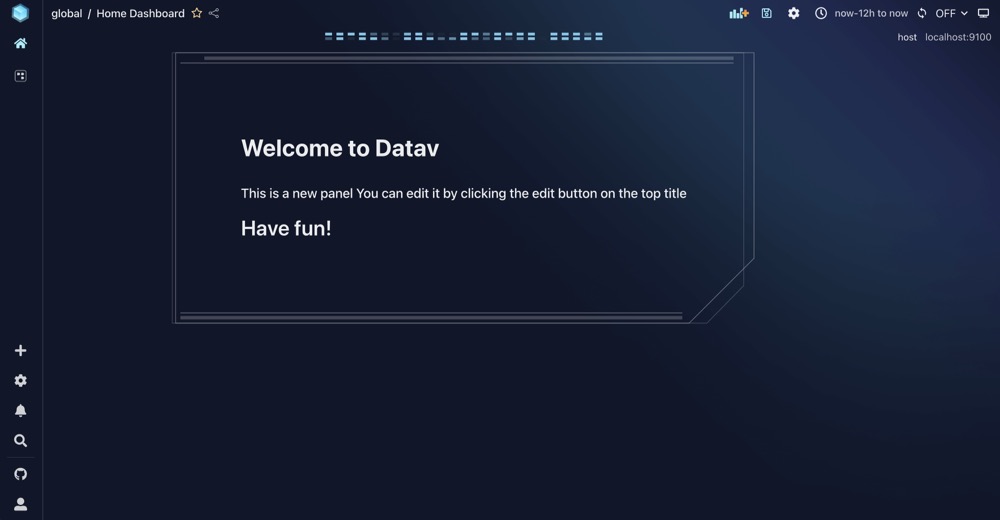
Create a Graph panel
At this time, welcome panel is useless for us, let’s change to a Graph panel.
- Open panel editor of welcome panel
- Change visualization to
Graph - Change datasource to
prometheus, select metricsgo_gc_duration_seconds_count, because our alert rule is based on this metrics.
Now, you should see a Graph panel like this:
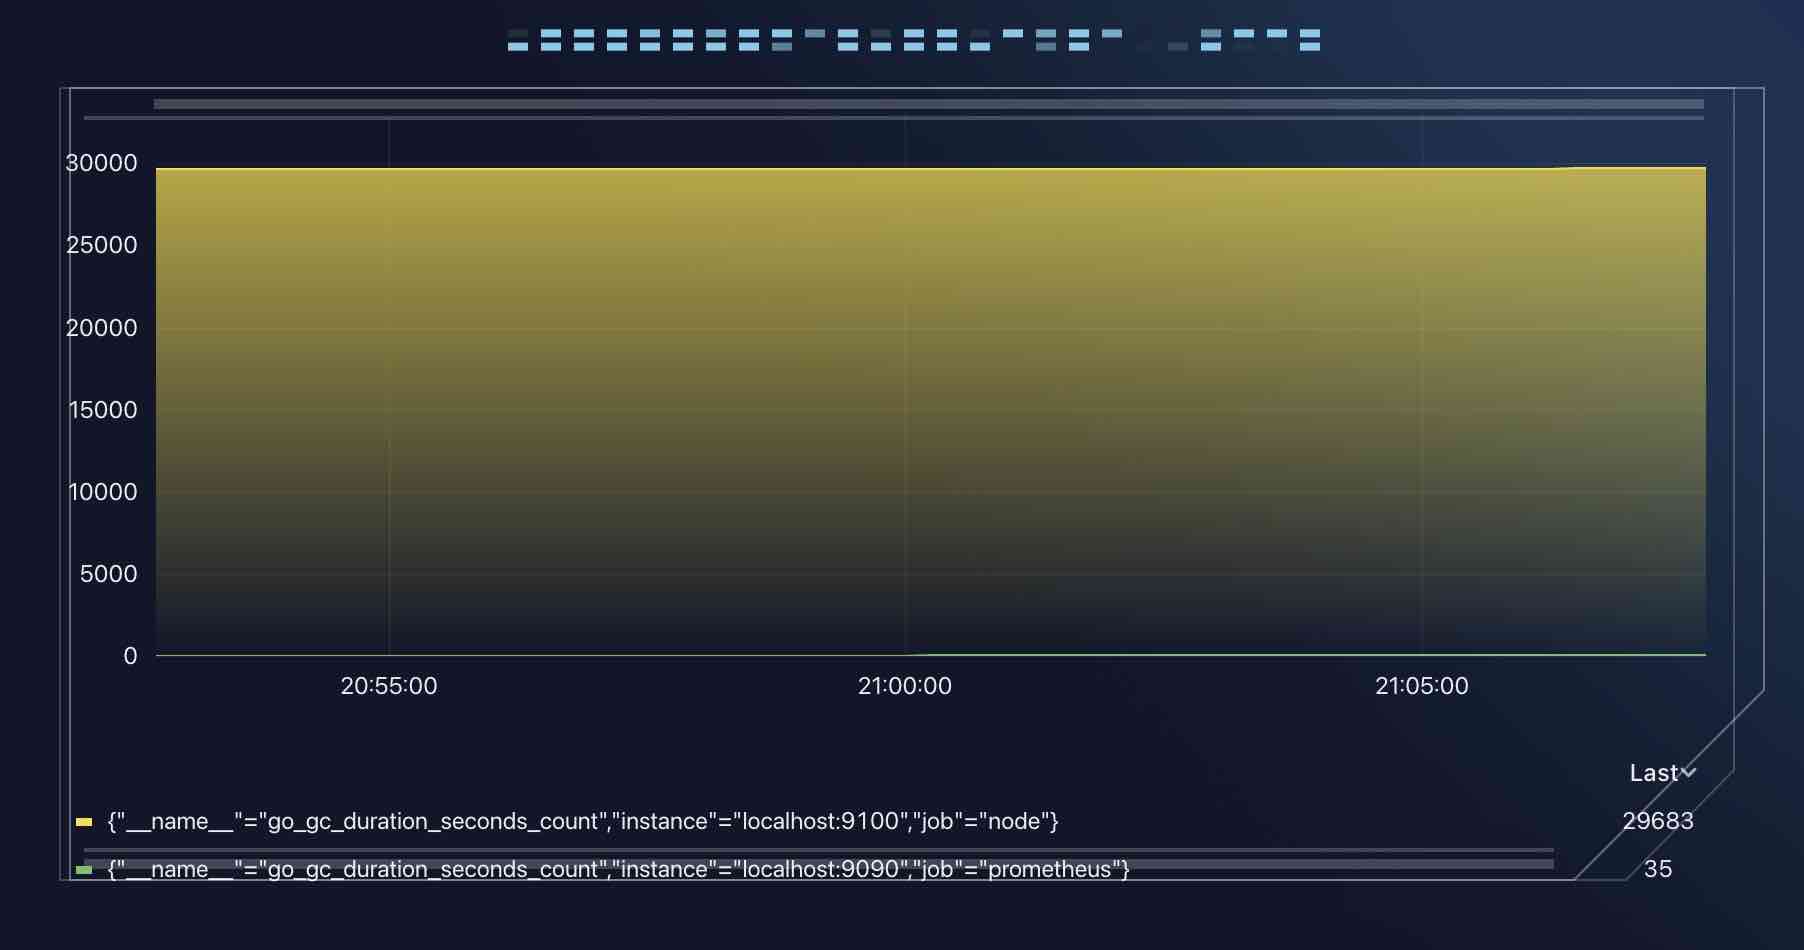
It seems that the current panel border and decoration is not very suited to our Graph panel, let’s try to change it.
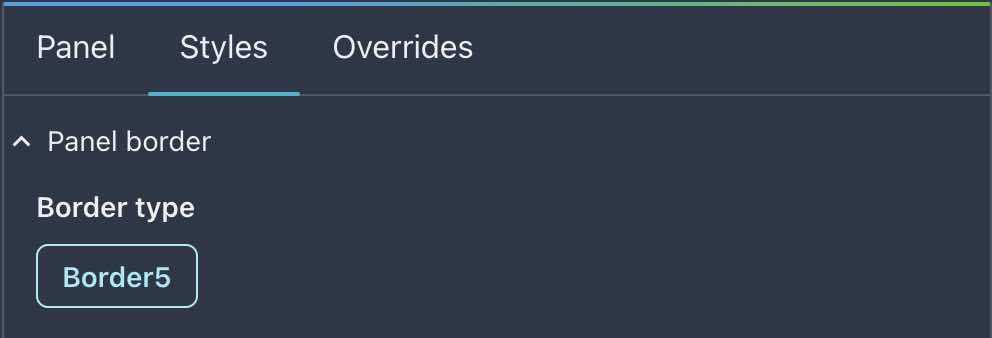
Change panel border and decoration
- Open panel editor of Graph panel, select
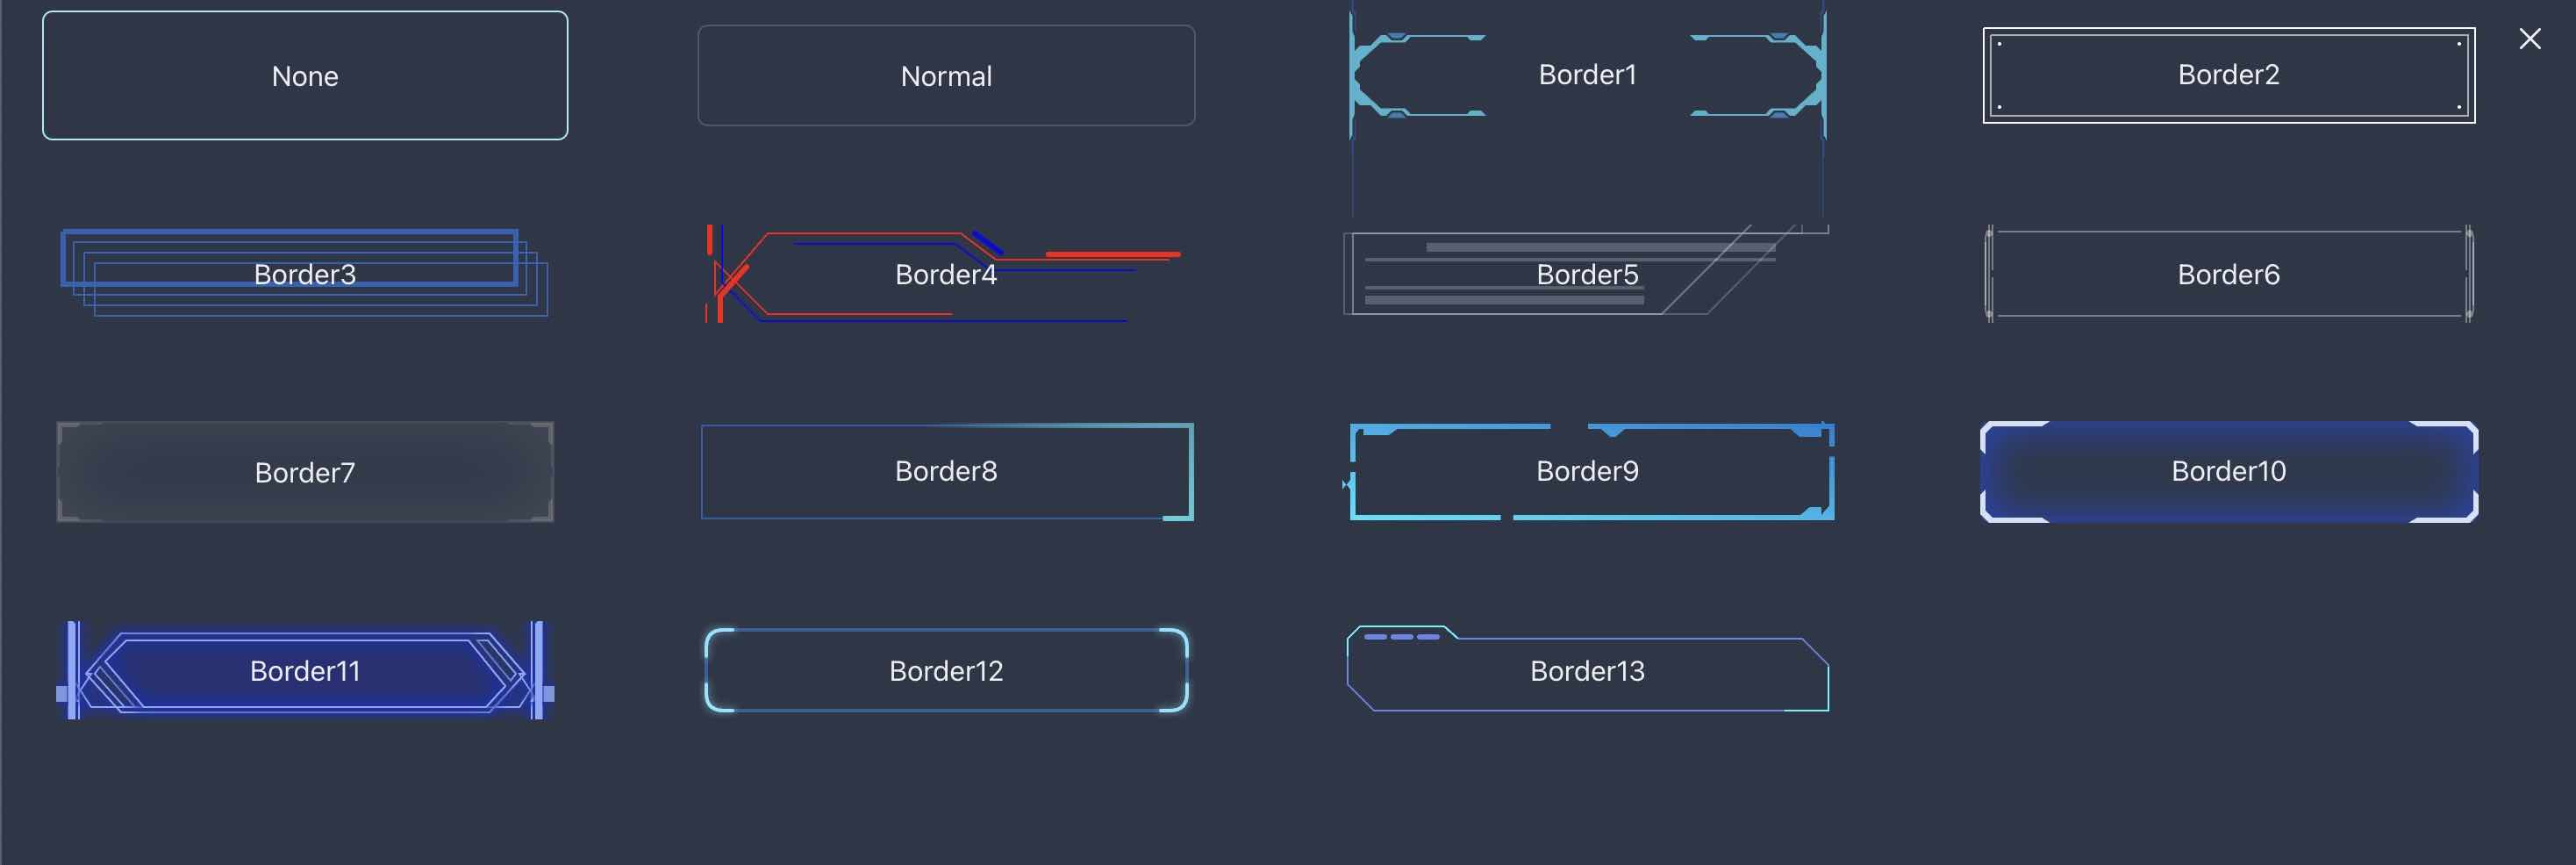
Styletab in right side. - Click below button to select a new border
- For convenient, just select no border for now
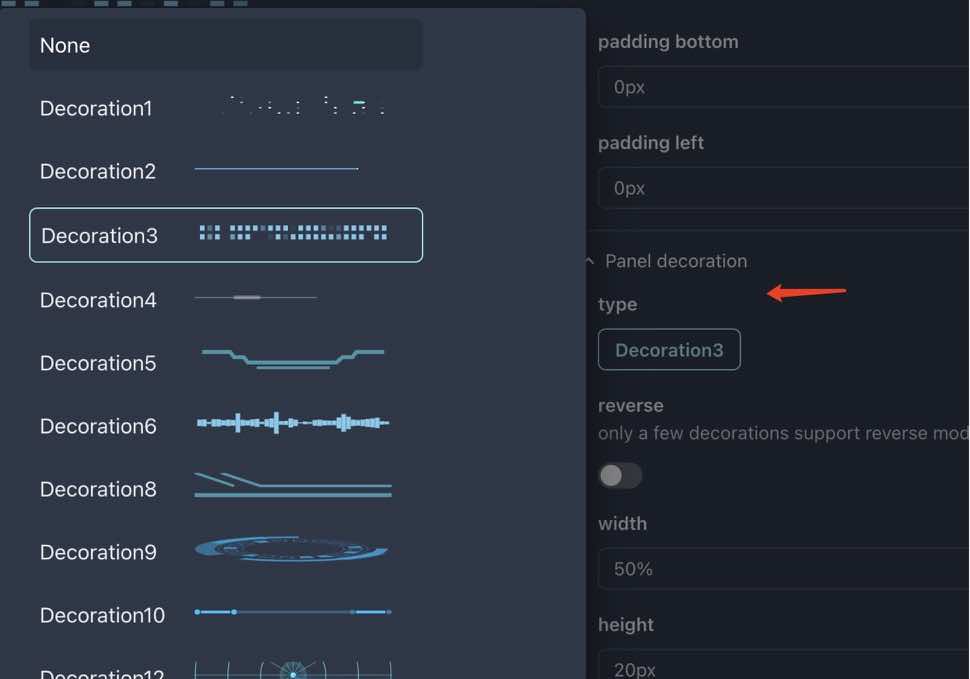
- Same to panel decoration, find
Panel decorationsection and set it to none
Now, you should see a Graph panel like this:
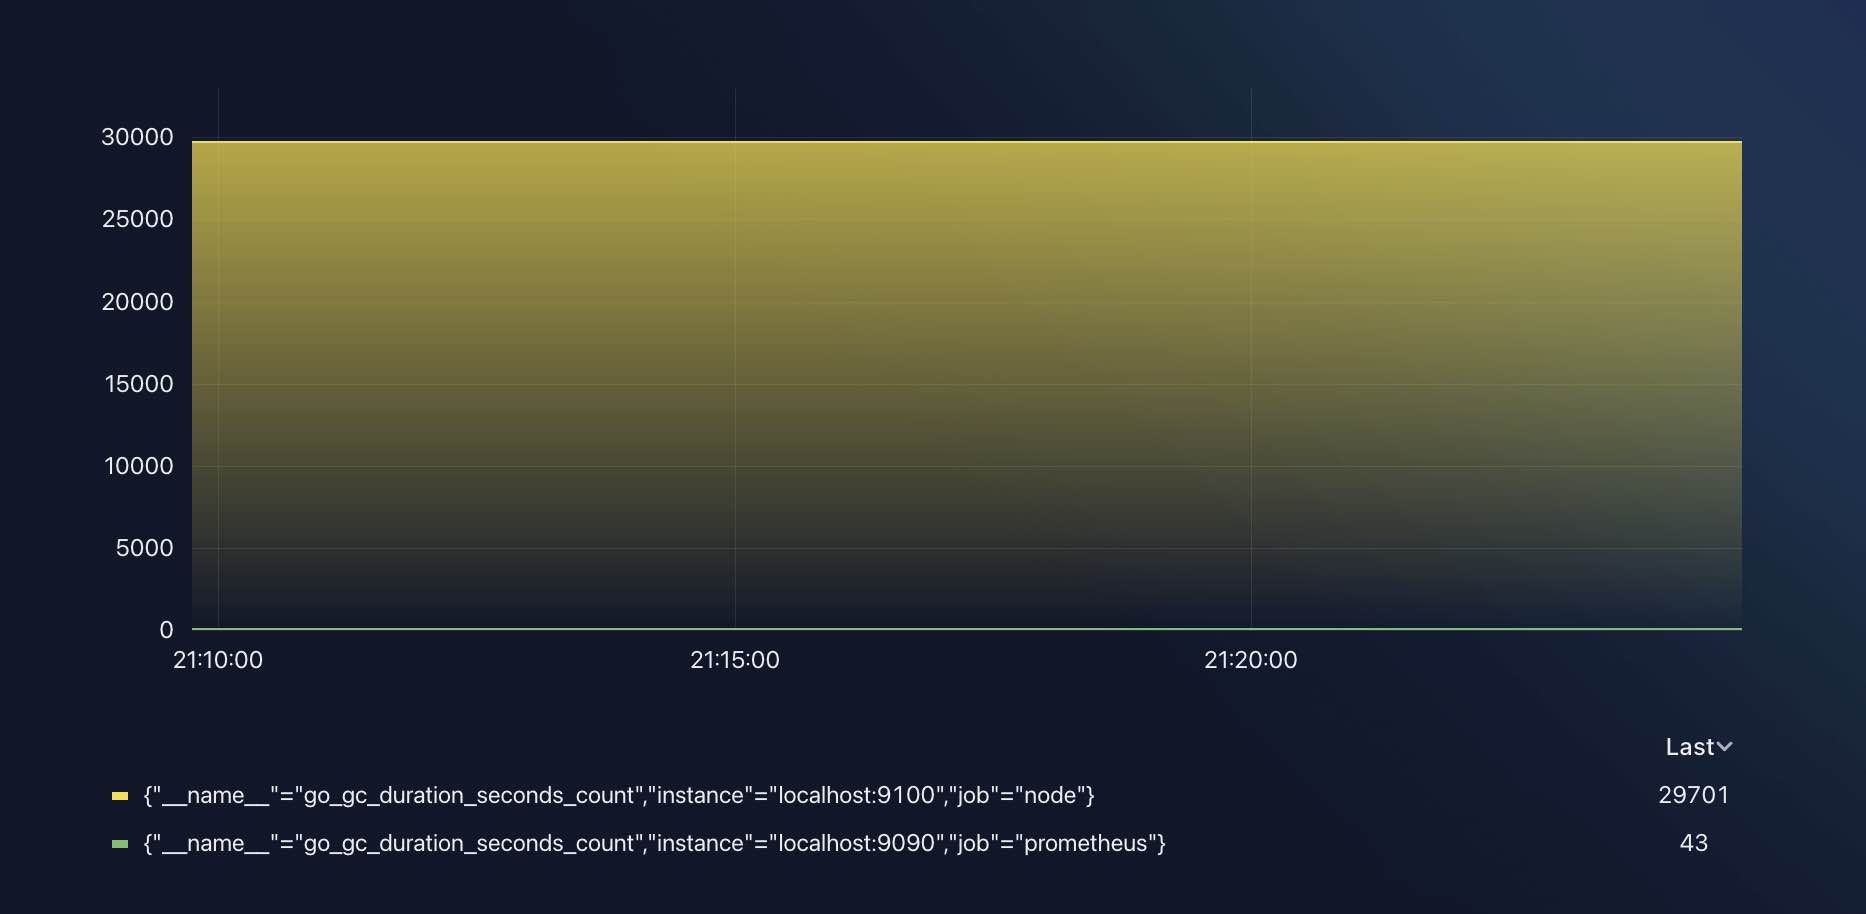
It looks much cleaner now, no border and no decoration, just a pure Graph panel.
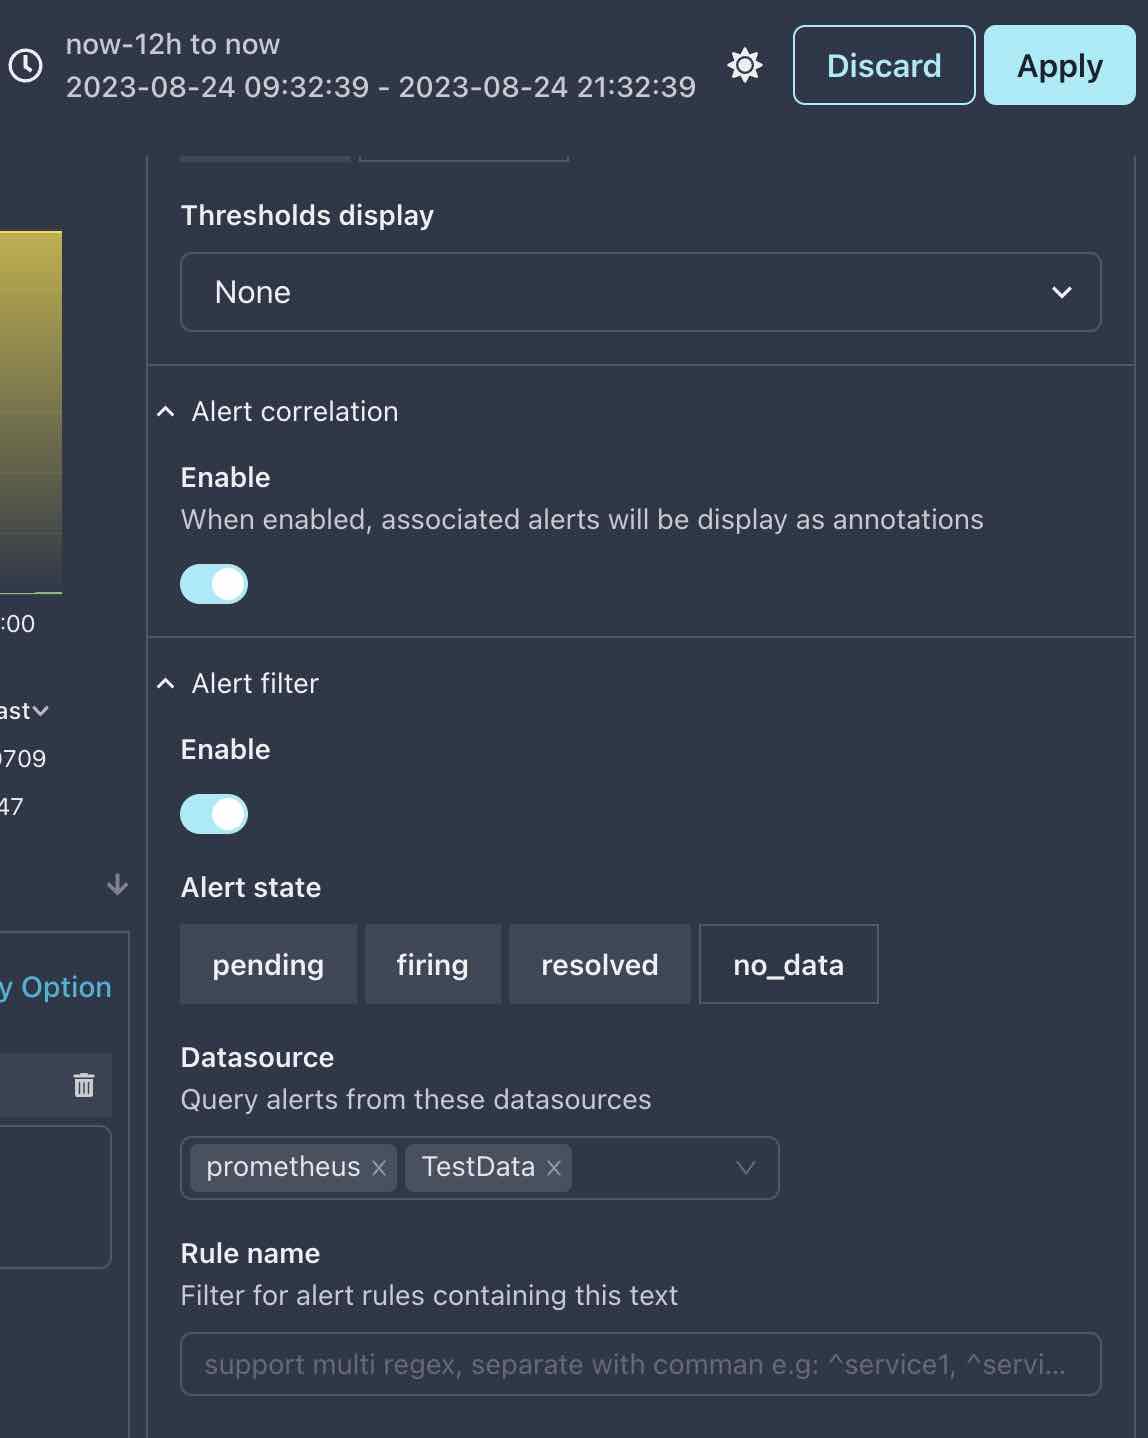
Enable alert correlation
Locate the Alert correlation section in Panel tab in right side of panel editor.
As you can see in the field tips: when correlation is enabled, alerts will be shown as annotation marks on the Graph.
Now, lets enable it and see what will happen.
- Switch
Enabletoon - Select
prometheusdatasource, if there is no alerts, you can also addTestDatadatasource. - Set
Alert statefilter toPending,FiringandResolved, if you choose none, then no alerts will be shown on Graph. - Maybe you need to set time to a wider range, such as
now-12h to now
If everything is ok, you should see a Graph panel like this:
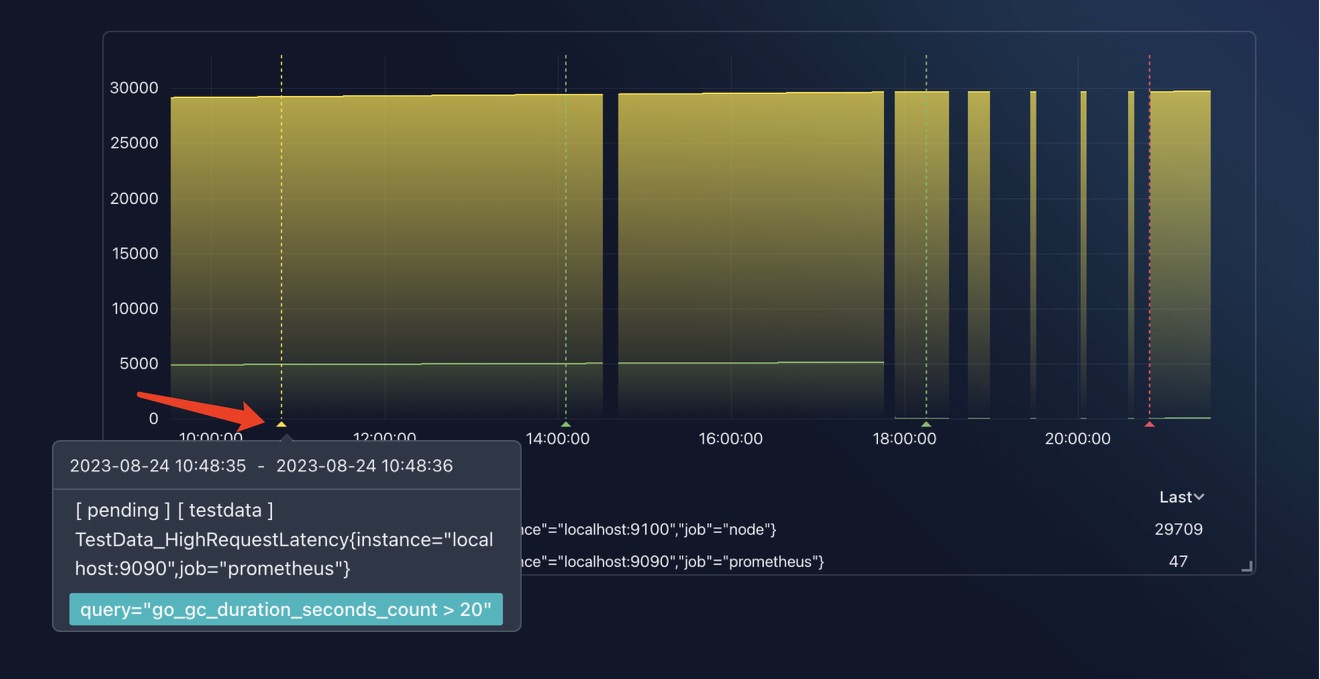
Hover your mouse on the mark which the arrow points to, you will see the alert info pop up.
View alerts details
Annotation marks on Graph panel is just a simple way to show alerts, if you want to view more details about alerts, you can do this:
- Open panel editor of Graph panel
- Select
Alerttab in bottom-left side of panel editor
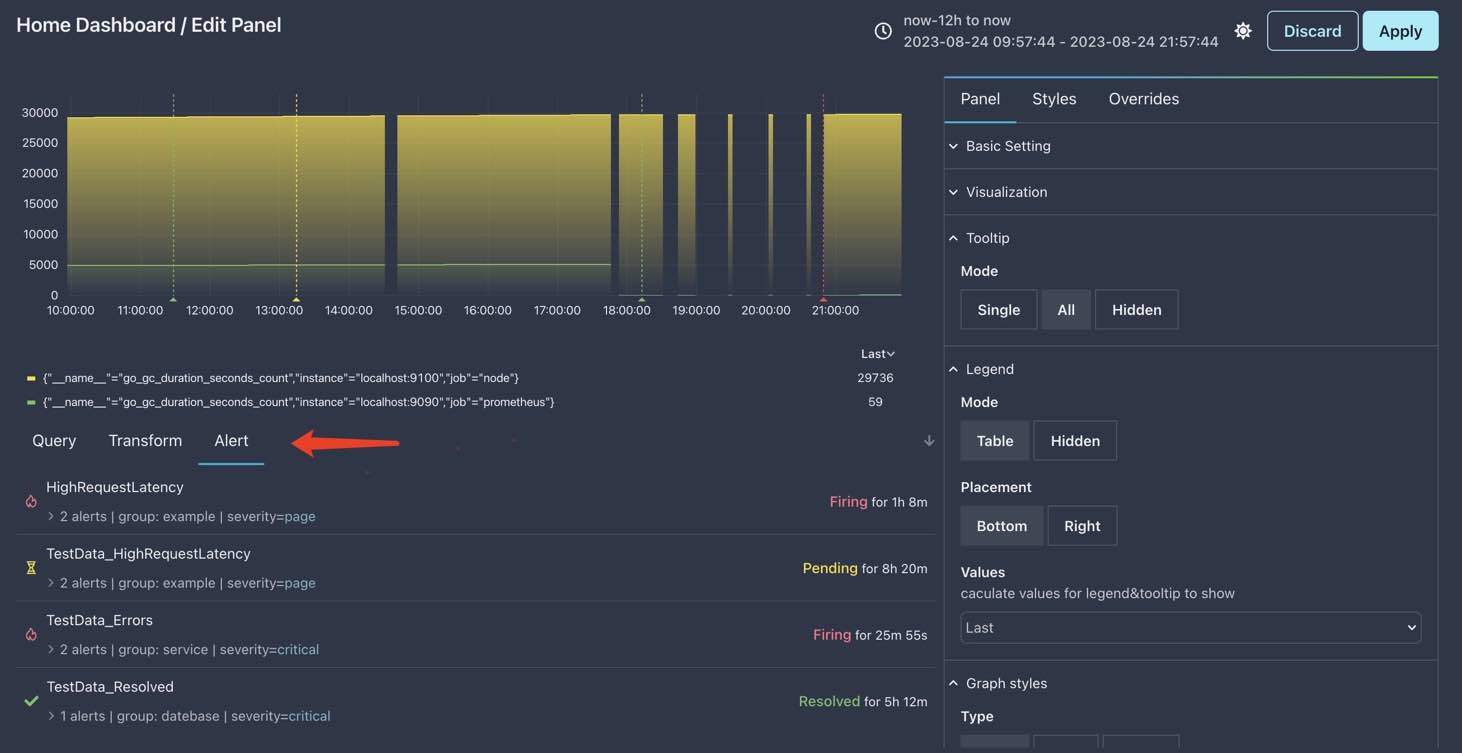
It is very similar to /alert page, but here you can see the alerts and Graph at the same place.
In fact, you can customize the
/alertpage with two panels to achieve the same effet as above: one Graph panel for showing alert marks, and one Alert panel for showing alert list.