- Panel Plugins
- Log
Panel Plugins
Log
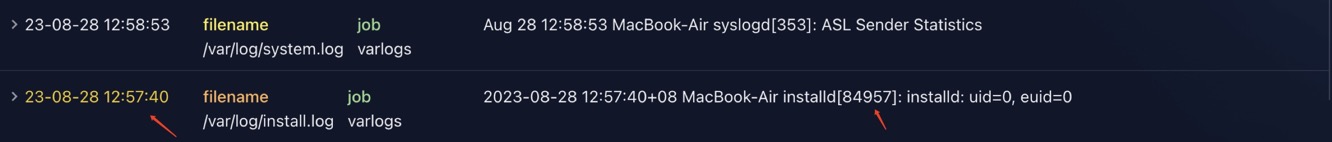
Log panel is used for display logs, especially the Loki logs.
Wow, it looks there are many colors in the Log panel.. Wh do you guys design it like this?
Don’t worry, all the colors are customizable, colors in the above image are already customized, by default, there is no colors at all.
Toolbar
If you click the toolbar icon in the top right corner, you will see the toolbar as below:
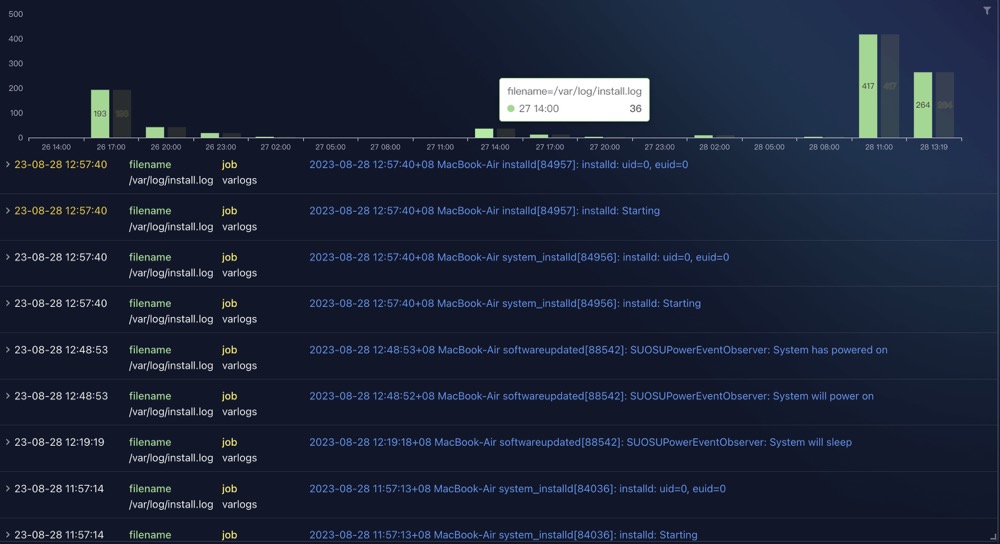
Filter logs
You can see, we can filter logs by labels in the toolbar or by clicking the chart.
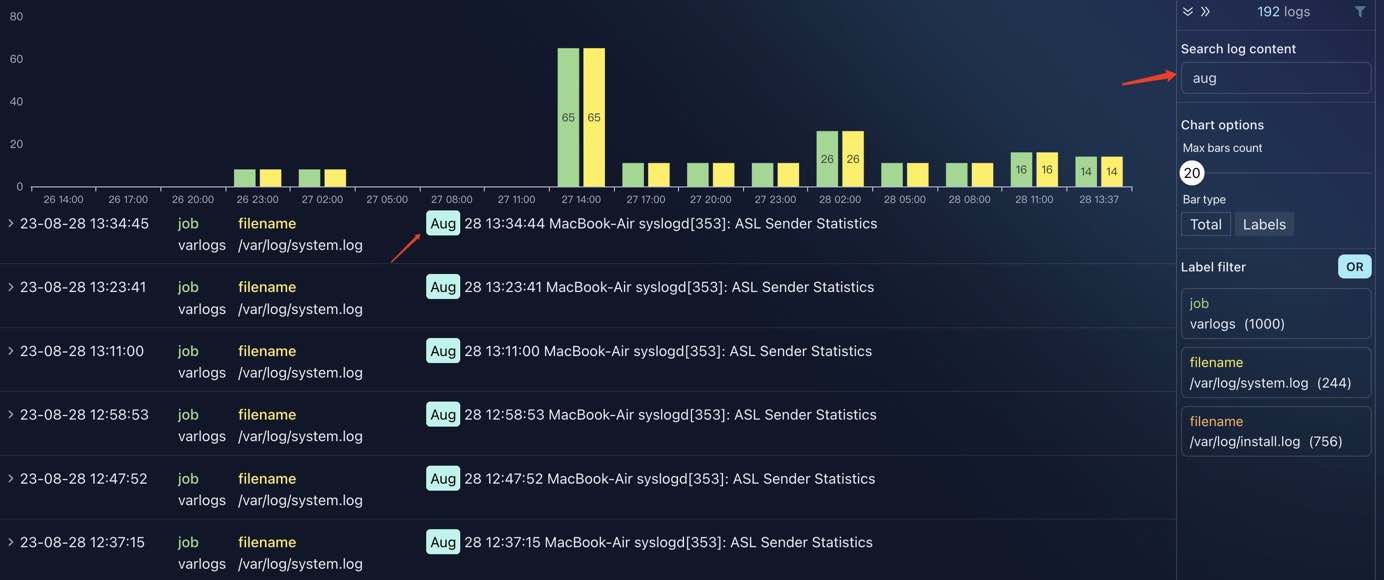
Search logs
Search logs is also a powerful weapon for you to find the logs you want:
Threshold
You may wonder, how can we add value type thresholds to the log panel? The answer is we don’t add value type, instead we add text or label match type.
Threshold will change the timestamp color, not all the log row color.
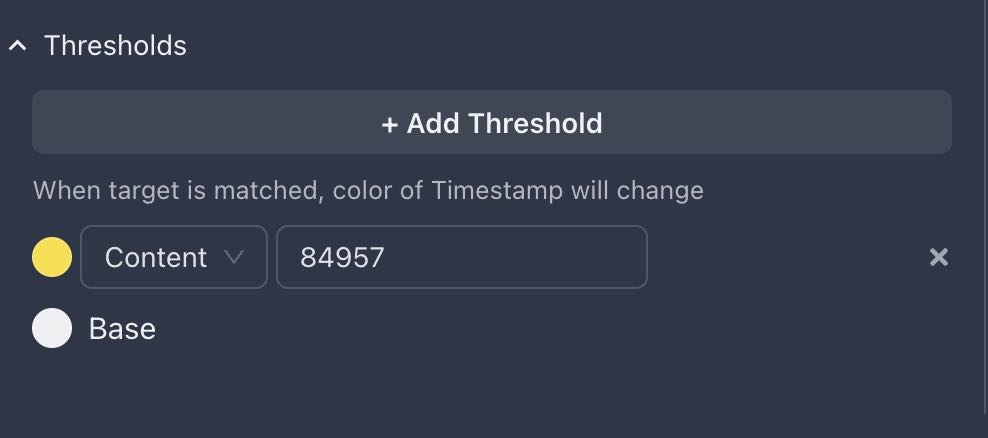
Here we match the logs that contains 84957 in theri contents, the result is as below: