

- Panel
- Conditional rendering
Panel
Conditional rendering
Plugins and configuration settings that can improve the developer experience when working with Tailwind CSS.
If you want to show or hide a panel based on a condition, you can read this doc.
From this short video, we can see: there are two panels in the dashboard, one is NodeGraph panel, the other one is Table panel, they both show the dependency graph from Jaeger in different view type, and they are both very useful.
But we don’t want to show both of them at the same time, because it will occupy too much space in the dashboard.So we need to show or hide them based on a given condition.
Prerequisite
Before we start, we need to do some preparation:
- Deployed Jaeger
- Add jaeger datasource in xObserve
- Using hotrod provided by Jaeger to generate some traces
These are not required, but if you want to follow this doc step by step, you need to do them
If you only want to try conditional rendering, you can create two panels with any kind visualization you like, and start from step
Add a condition
Create two panels
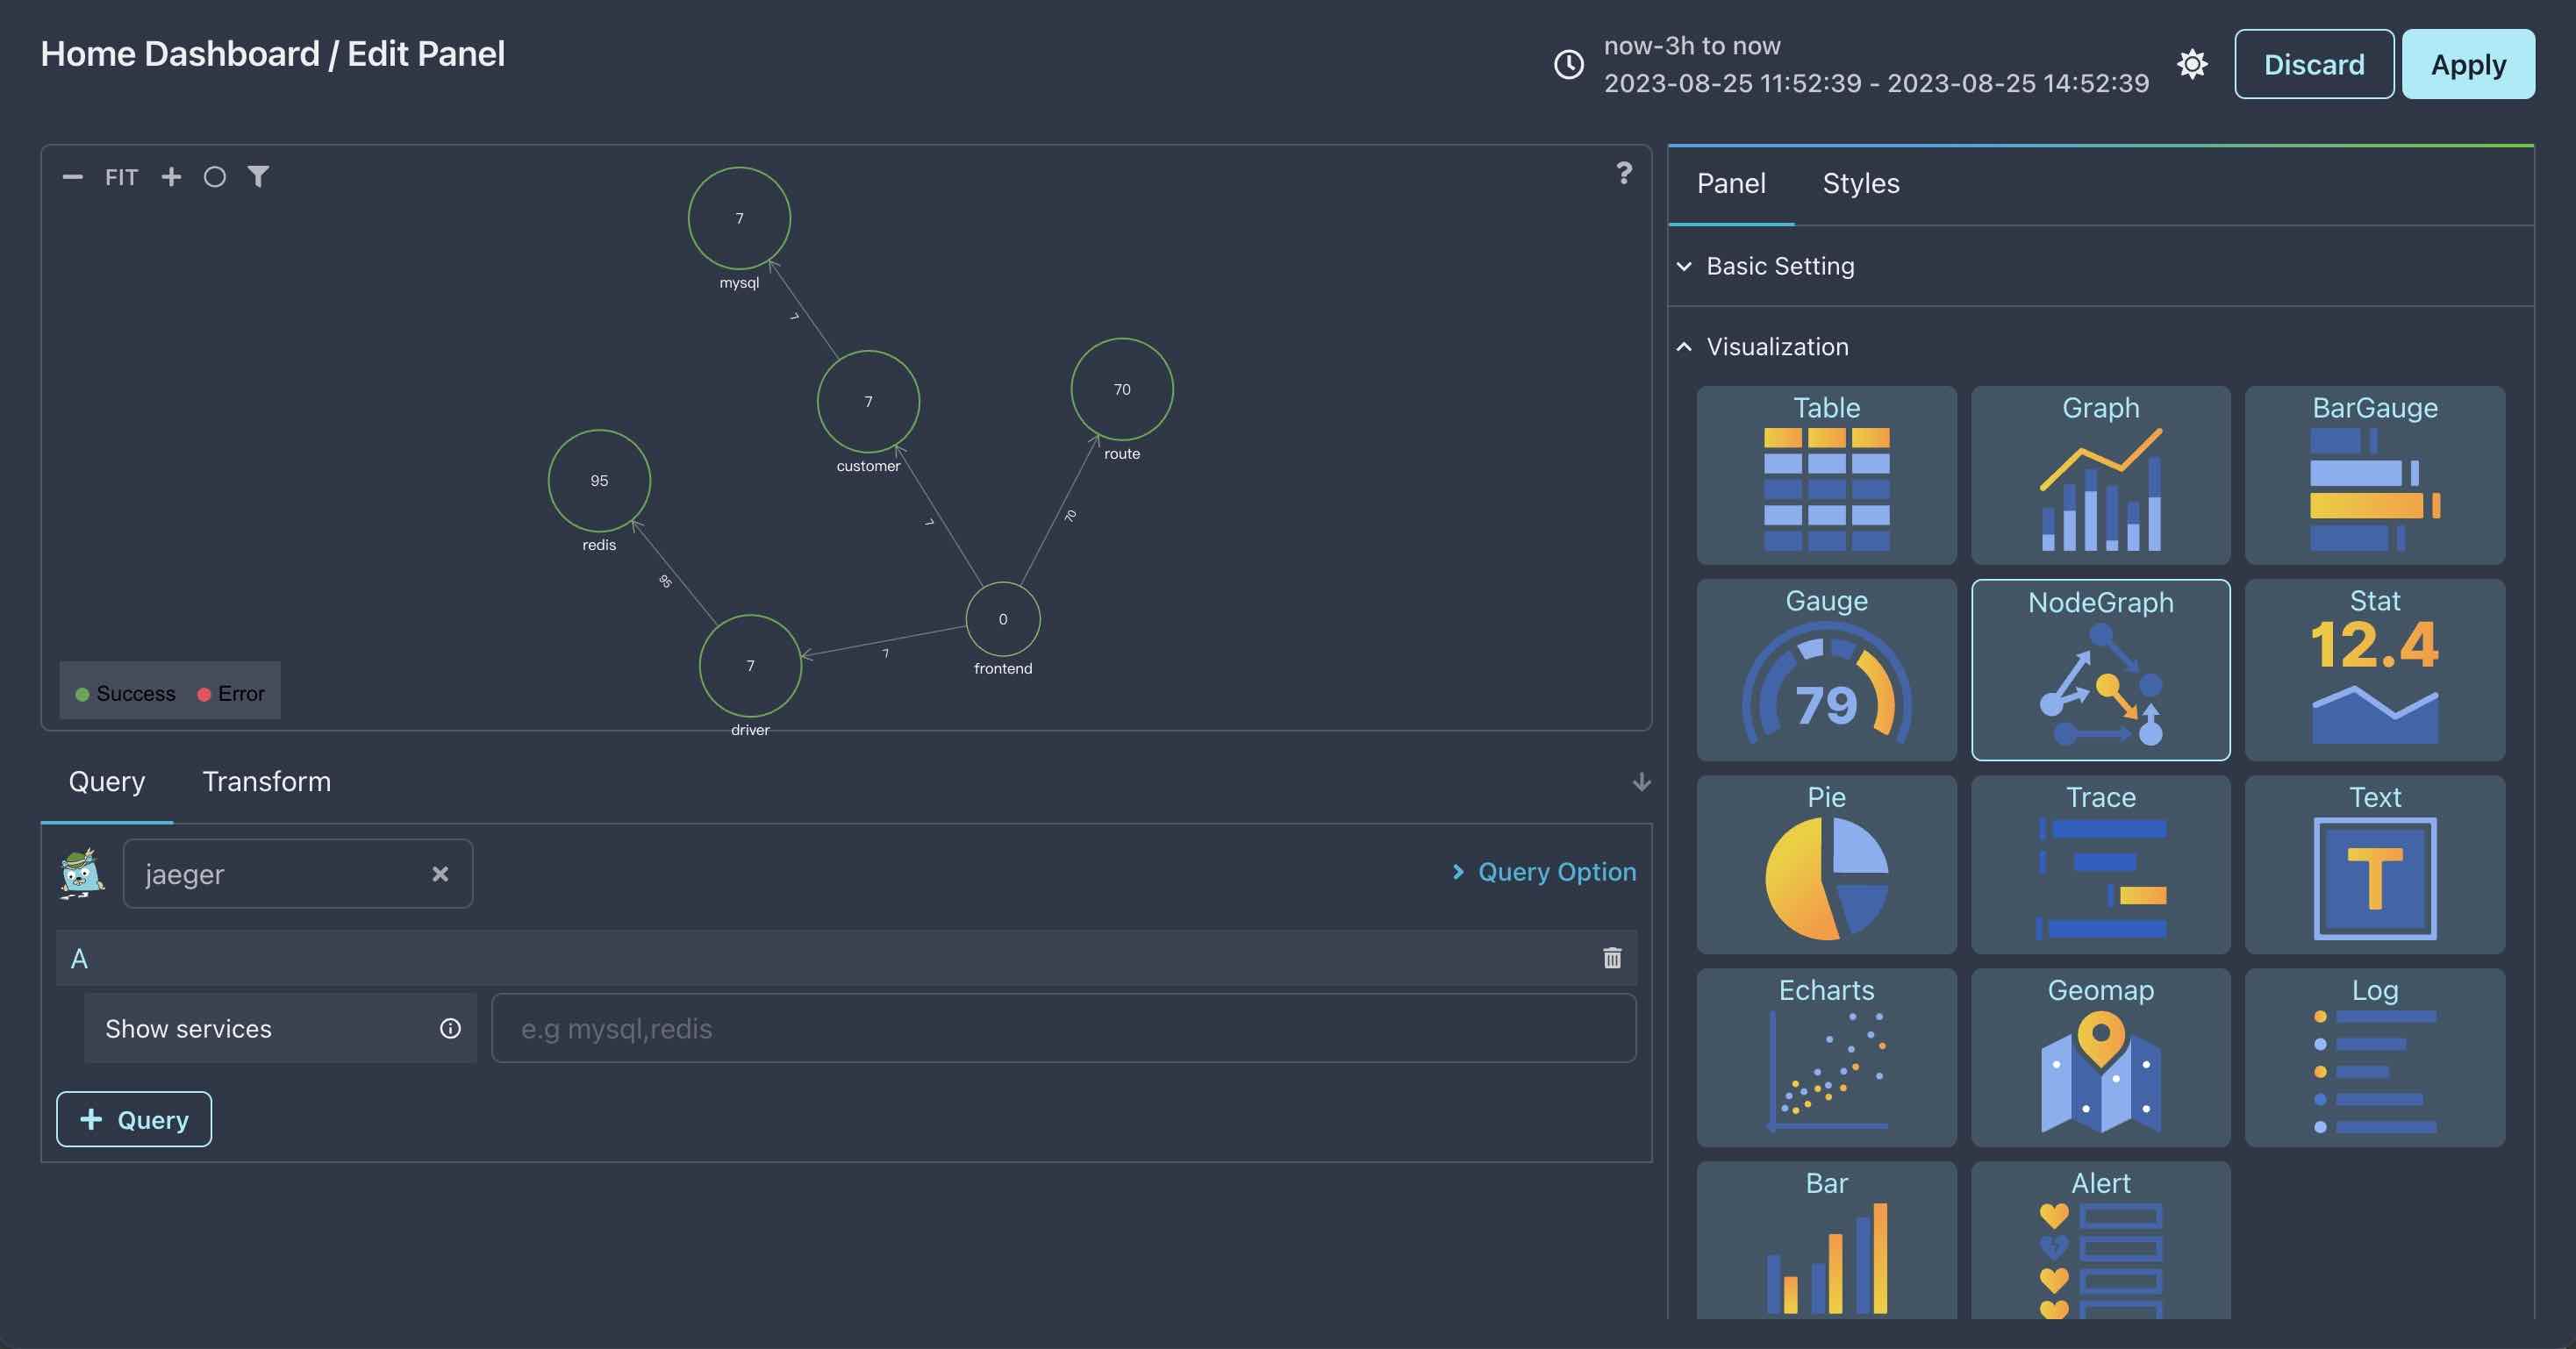
Create NodeGraph panel
Add a new panel and select NodeGraph visualization for it, then set its datasource to Jaeger, you should see:
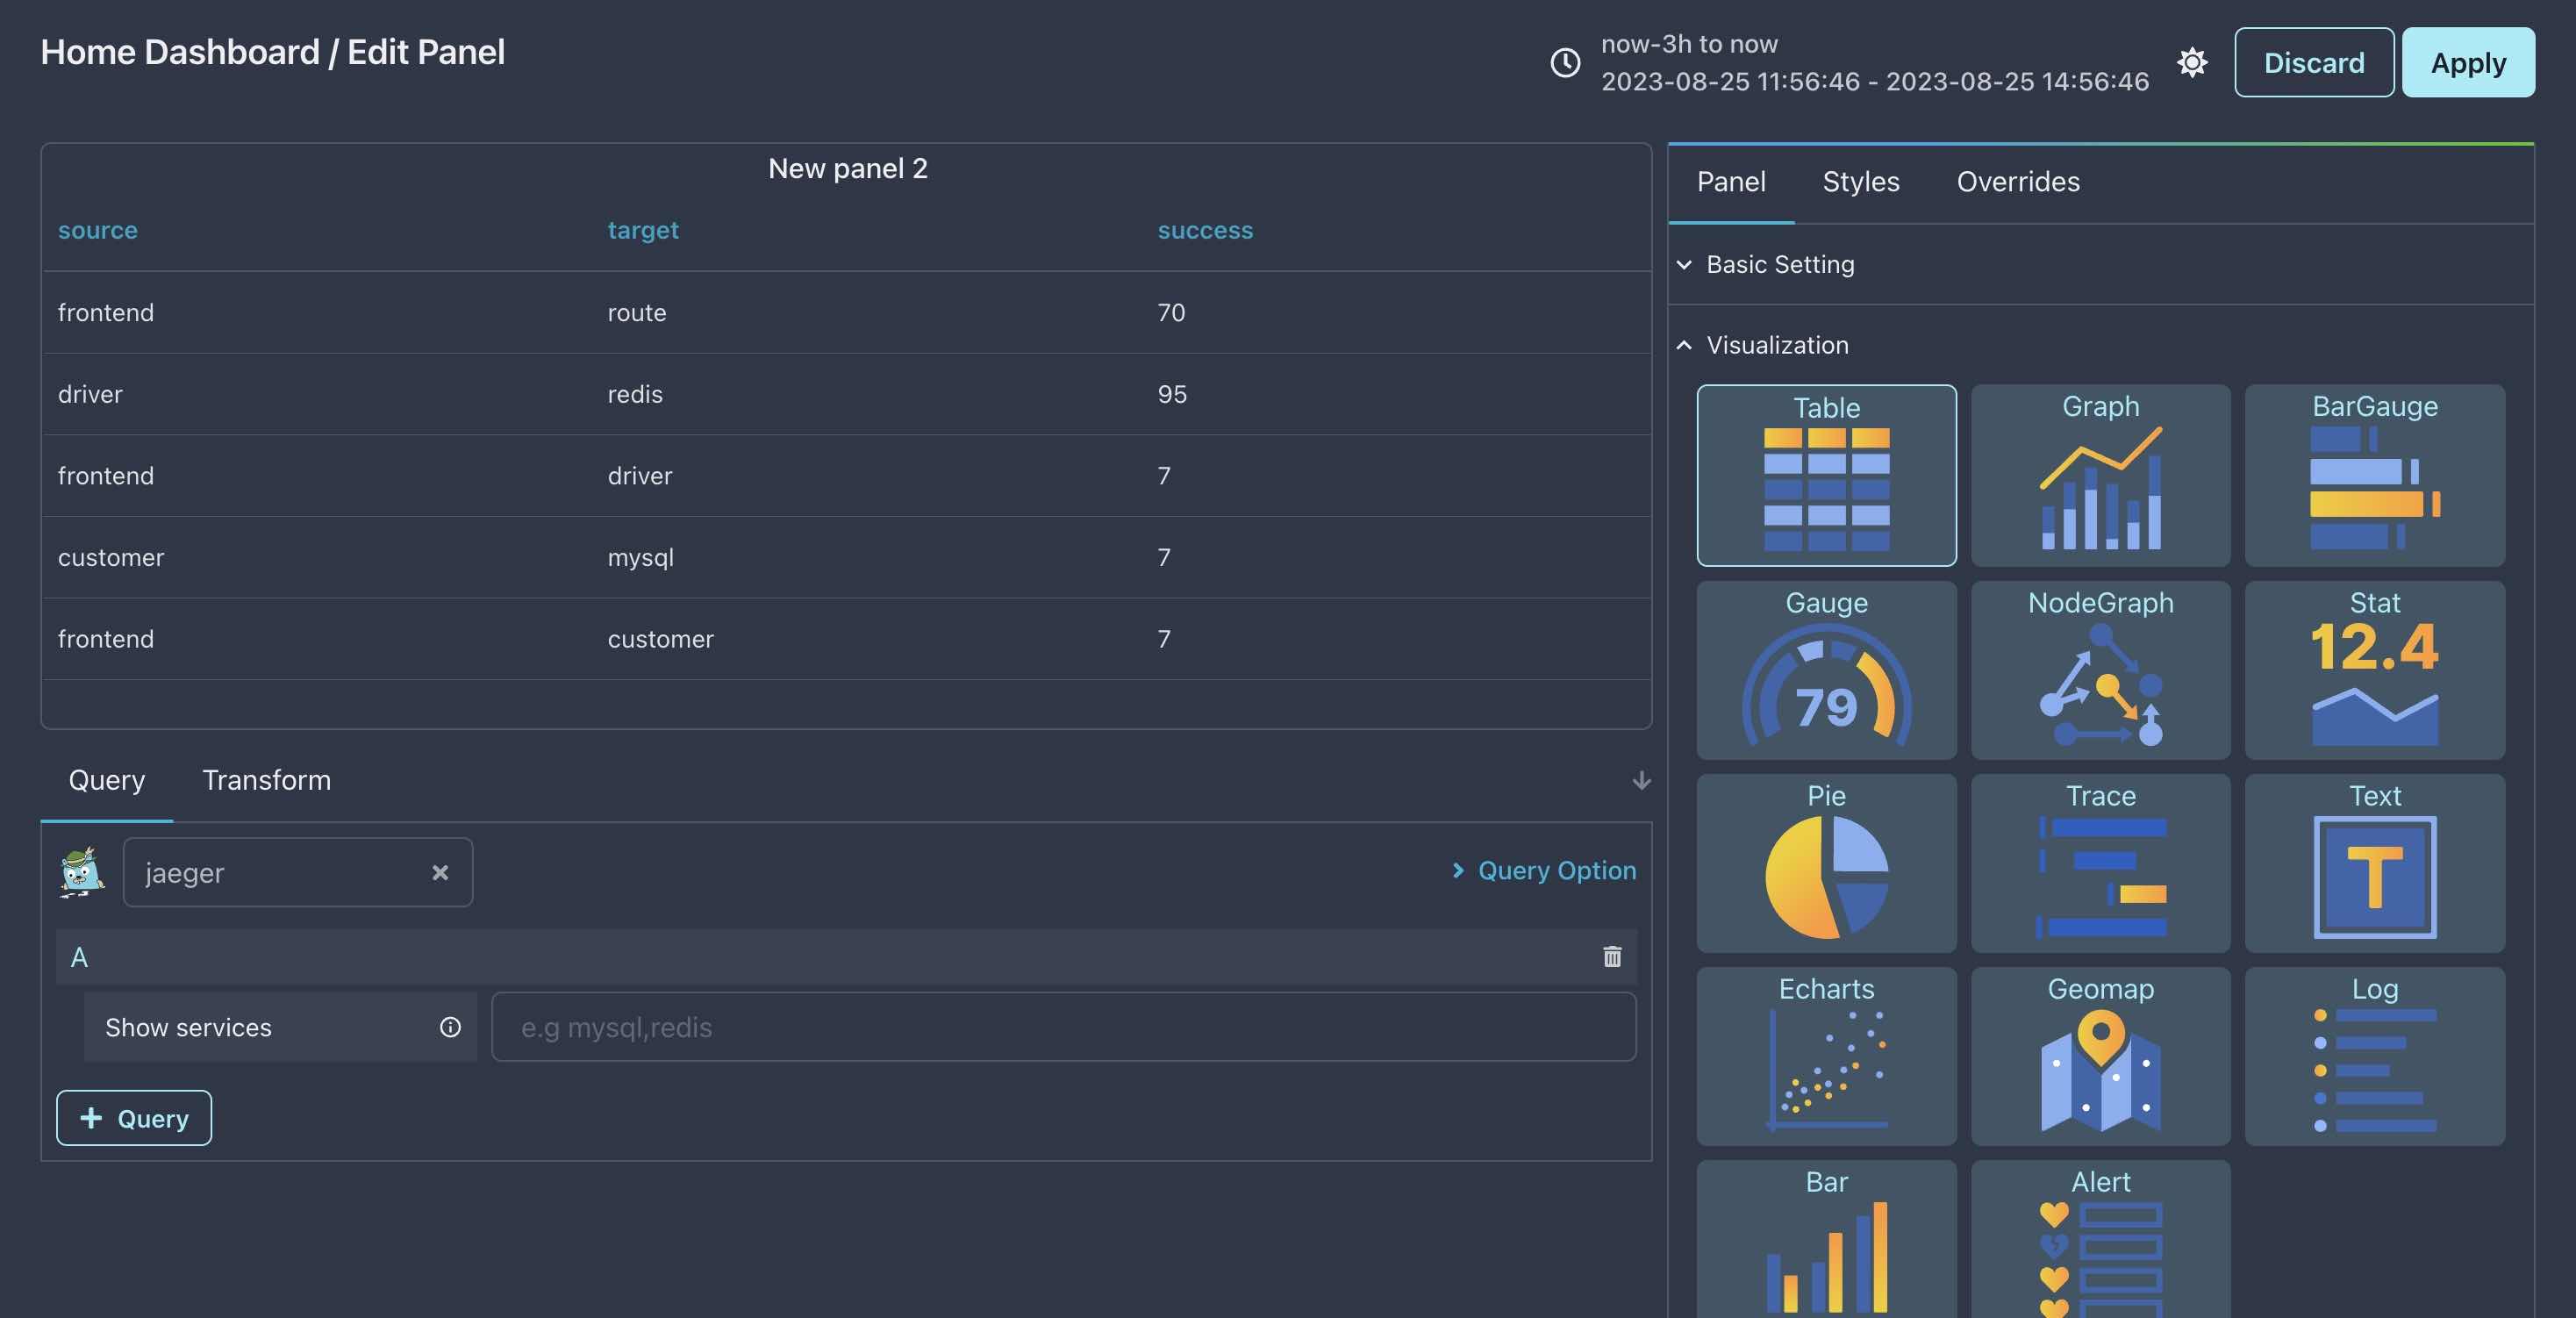
Create Table panel
Add another panel and select Table visualization for it, then set its datasource to Jaeger, you should see:
Return back to dashboard page, as you can see, there are two panels show in the dashboard.
Add a condition
For now, we can only use variables as condition, therefore, let’s create a dashboard variable named view and it has two values: nodegraph and table.
If you forget how to create variable with custom values, please read this doc.
Set condition for panels
We need to set condition for both panels, so let’s start with the NodeGraph panel.
Open panel editor of NodeGraph panel, and click Panel tab, expand Basic Setting section and find Conditional Render, then fill it as below:
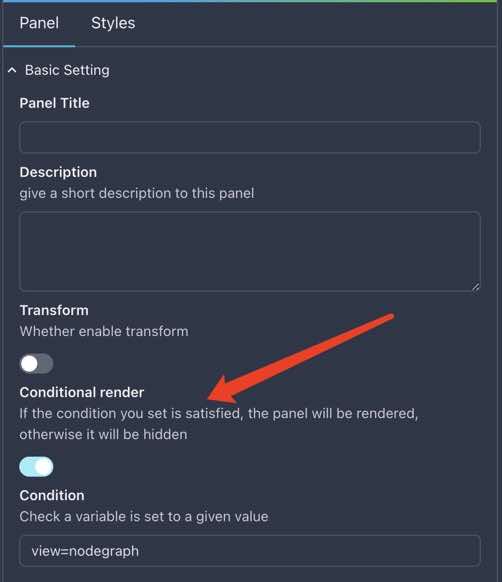
Condition value view=nodegraph means only render this panel when view variable is set to nodegraph.
Do the same thing to Table panel, but set condition value to view=table.
Test it
All right, that’t it, very simple, now we can test it as the first video shows:
try to change view variable value to nodegraph or table, and see what happens.