- Panel
- Panel data and transformation
Panel
Panel data and transformation
In grafana, all data is in Dataframe formats, but in xObserve, the data passed to panel for rendering has various formats, such as
- Timeseries data( SeriesData ) format, this is the most common format for timeseries data, used in many panels, such as Graph, Gauge, Table, Stats etc.
- NodeGraph d`ata format, includes nodes and edges info
- Trace data format, same as jaeger
The data formats these panels require are not compatible with each other, if we use one unify format to represent them, the data format would be hard to understand and use. So we use different data formats for different panels.
For most users, there is no need to care about the data format, because the data format is automatically converted by the panel. But if you want to query data from your own http backend, you need to know the data format of the panel you are using.
But we are not going to talk much about the detail about each data format, because what is more important is how you can find the data format when needed.
Final data format
Defination for final data format: The data format that is directly used by the panel is the final data format.
For example, if you use HTTP datasource to query data from external HTTP API, and the data format is A, then you must convert A format to the final data format that the chart requires before displaying it.
How to find the data format
We can find the data format of the panel in the following ways:
- Click panel header and select
Debug Panel - Select
Panel Datatab, you should see the data format as below:
[
  [
    {
      "id": 65,
      "name": "{\"__name__\"=\"go_goroutines\",\"instance\"=\"localhost:9090\",\"job\"=\"prometheus\"}",
      "length": 21,
      "fields": [
        {
          "name": "Time",
          "type": "time",
          "values": [
            1692950385,
            1692950400,
            1692950415,
          ]
        },
        {
          "name": "Value",
          "type": "number",
          "values": [
            34,
            34,
            34,
          ],
          "labels": {
            "__name__": "go_goroutines",
            "instance": "localhost:9090",
            "job": "prometheus"
          }
        }
      ],
      "rawName": "{\"__name__\"=\"go_goroutines\",\"instance\"=\"localhost:9090\",\"job\"=\"prometheus\"}",
      "color": "#73BF69"
    },
    {
      "id": 65,
      "name": "{\"__name__\"=\"go_goroutines\",\"instance\"=\"localhost:9100\",\"job\"=\"node\"}",
      "length": 21,
      "fields": [
        {
          "name": "Time",
          "type": "time",
          "values": [
            1692950385,
            1692950400,
            1692950415,
          ]
        },
        {
          "name": "Value",
          "type": "number",
          "values": [
            7,
            7,
            7,
          ],
          "labels": {
            "__name__": "go_goroutines",
            "instance": "localhost:9100",
            "job": "node"
          }
        }
      ],
      "rawName": "{\"__name__\"=\"go_goroutines\",\"instance\"=\"localhost:9100\",\"job\"=\"node\"}",
      "color": "#FADE2A"
    }
  ]
]
The above data is the final data format of Graph panel, each item in the list is a SeriesData format.
This final data format can be described as below:
Nodegraph format
Let’s have a look at the final data format of NodeGraph panel.
Change panel visualization to NodeGraph and view panel data n Panel Debug -> Panel Data:
[
  {
    "nodes": [
      {
        "id": "frontend",
        "label": "frontend",
        "data": {
          "success": 0
        },
      },
      {
        "id": "route",
        "label": "route",
        "data": {
          "success": 70
        },
      },
    ],
    "edges": [
      {
        "source": "customer",
        "target": "mysql",
        "label": "7",
        "data": {
          "success": 7
        },
      },
      {
        "source": "frontend",
        "target": "customer",
        "label": "7",
        "data": {
          "success": 7
        },
      }
    ]
  }
]
If we want query data from http api, we should transform the query result to the above format to make it work.
Panel data transform
No matter how the data is transformed, it must be compatible with the final data format required by the chart, otherwise the chart will not be displayed correctly.
Sometimes, the data queried from datasource does not meet the requirements of the chart, so we need to transform the query result to the format that the chart requires.
For this reason, we need a method to modify the data queried from the datasource , and xObserve has provided a common data transformation function for us to do this.
Let’s take a look at an example: We need to convert the timestamp field in the data to a time string, so that we can see a more friendly time format in the Table.
Transform timestamp to time string
For table panel, we already know how to convert a timestamp column to a readable time string, if you don’t know how, please visit tutorial doc.
Now let’s find another way to do this for Table panel.
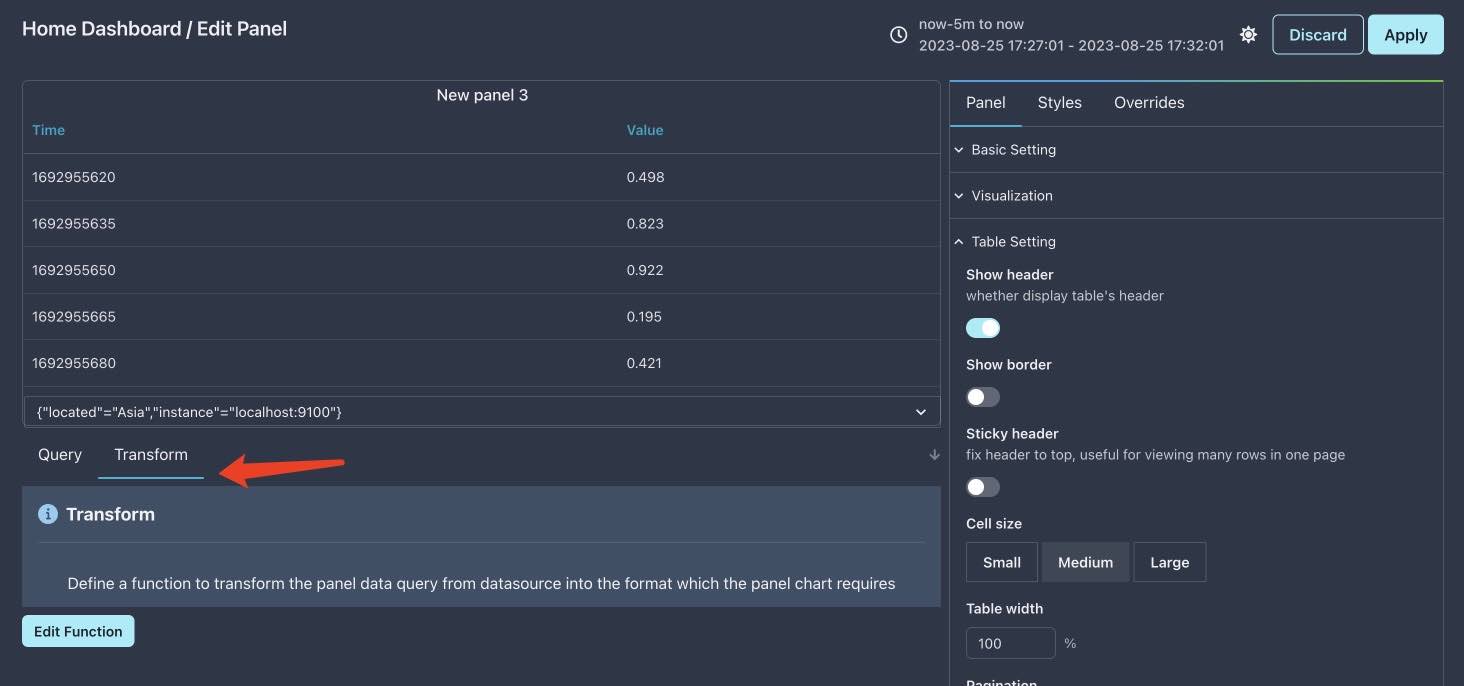
- Create a Table panel and use TestData datasource.
- Select
Transformtab

- Click
Edit Functionbutton - Fill function with code as below:
function transform(rawData,lodash, moment) {
    for (const d of rawData) {
        for (const series of d) {
            for (const field of series.fields) {
                if (field.type == "time") {
                    const values = []
                    for (const v of field.values) {
                        values.push(moment(v * 1000).format("YY-MM-DD HH:mm::ss"))
                    }
                    field.values = values
                }
            }
        }
    }
    return rawData
}- Press
Submitbutton
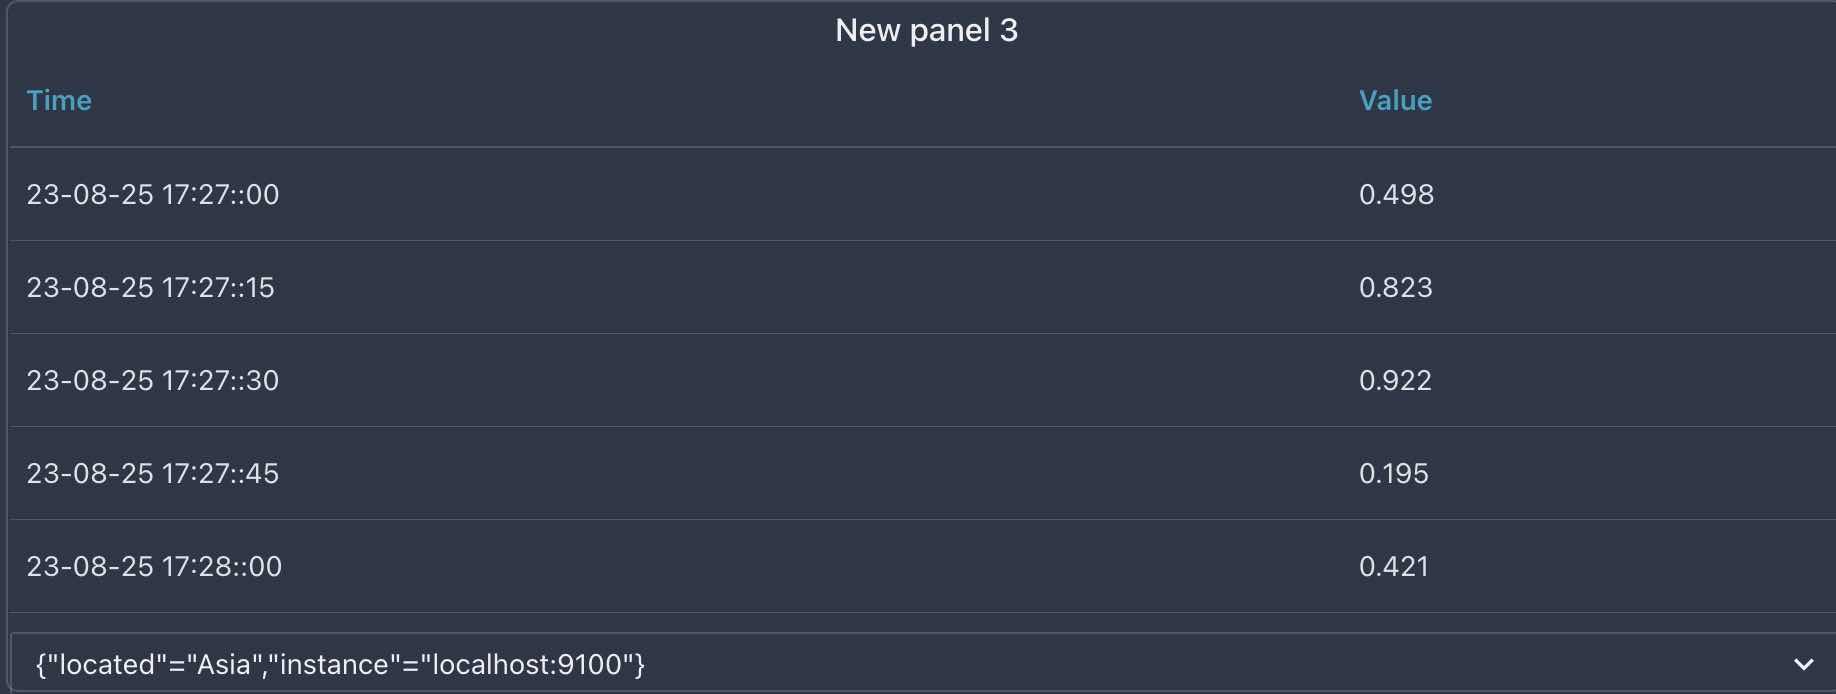
The data format of Table panel is SeriesData, and we change its time field’s value from timestamp to timestring to make it more readalbe.
It’s not a complex funtion, but very useful and is a good start for you to define your own transform function.
But, wait.. our table does not changes, it still shows time field as timestamp format.
Enable transfom
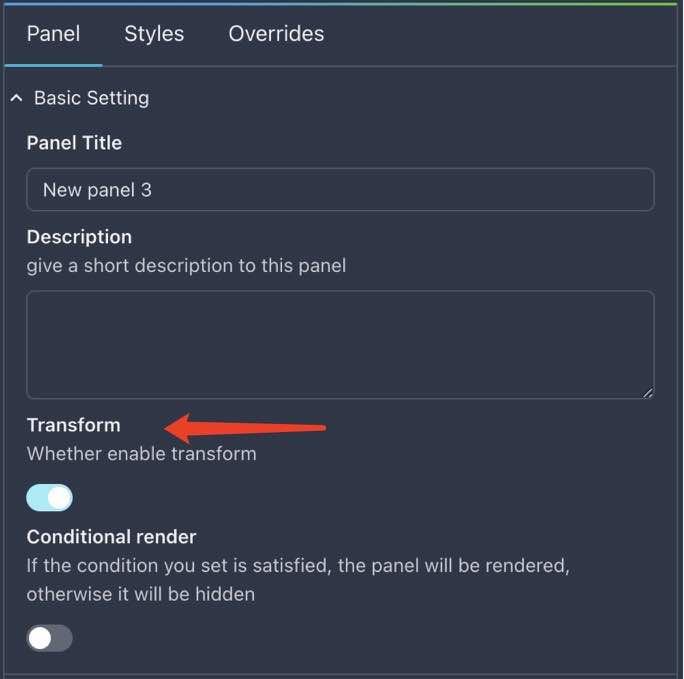
This is because we need manually enable the transform switcher in panel settings, otherwise the transform function will has no effect.
- Find the
Transformfield inPaneltab andBasic Settingsection - Switch
Transformoption toon

After doing this, the Time column of Table should show time string instead of the previous timestamp:

Conclusion: Final data format is very important
The final data format is very important in xObserve, no matter whether you want to transform the existing data or convert the incompatible data that query from an external HTTP API, the ultimate goal is to achieve the final data format.
If you want to know the final data format of a chart type, it’s also very simple: use TestData as datasource and select the chart type you need, then open Panel Debug -> Panel Data, the data format you see is the final data format.
Composition of final data format
The final data format is like this:
[
    dataOfQueryA,
    dataOfQueryB,
]
You can see, the final data format is a list, each item in the list is the result of a query.
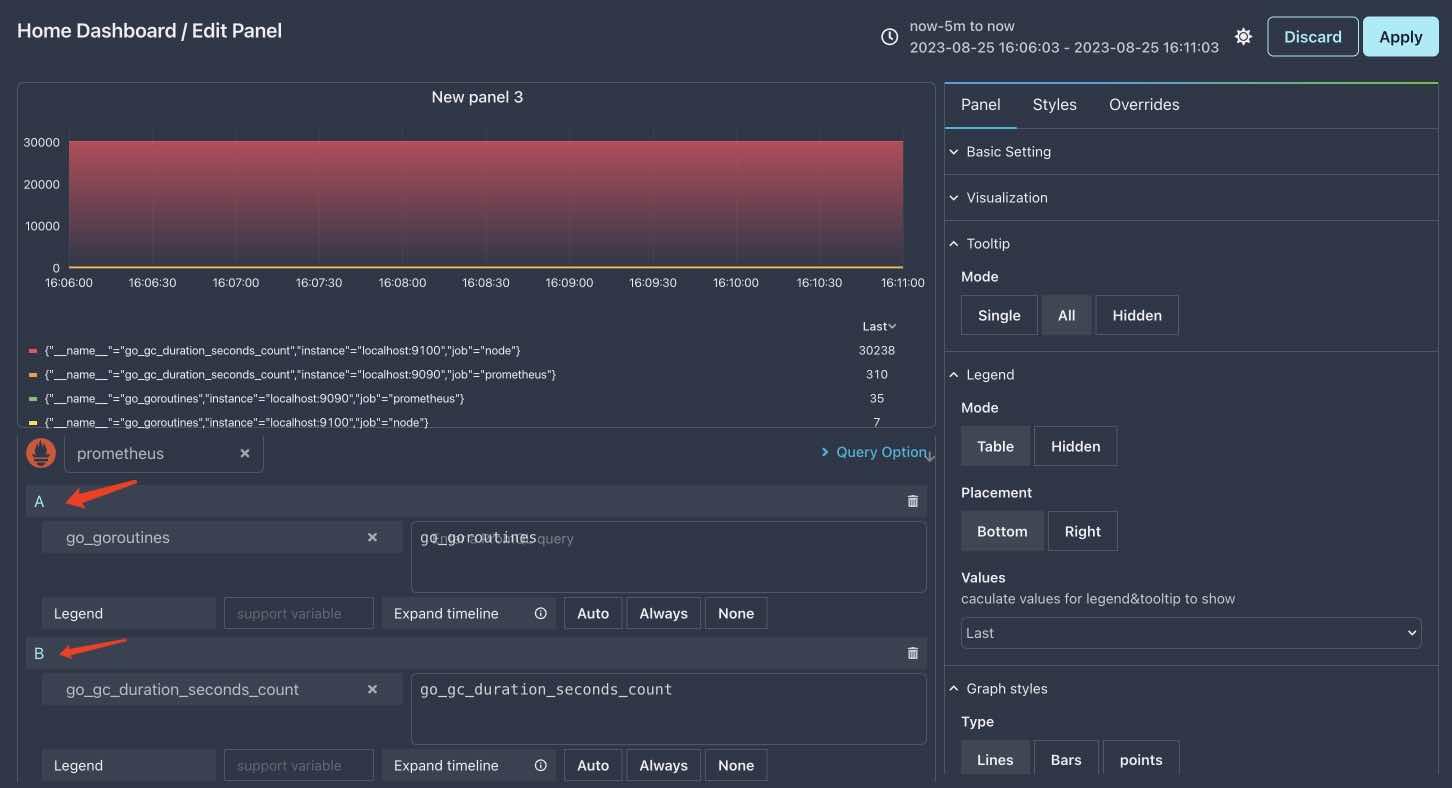
There are two objects in the list above, dataOfQueryA and dataOfQueryB, which are respectively queried by query A and query B defined in the chart.

In the above image, you can clearly see there are two queries in the panel, each of them will query a result and insert it into the final data format. In fact, you can add as many queries as you like to a chart, but we don’t recommend it, it will make the chart more complex than you would think.
Result query from HTTP datasource
If you are using HTTP datasource to query data from external HTTP API, then each HTTP request is equivalent to a query statement in the above chart.
There are two possibilities for the results queried by HTTP datasource:
- The format of the result is not supported by xObserve, in this case, you need to transform it to the final data format in the
Transformtab. - The format of the result is the same as the element format in the final data format list, in this case, you don’t need to transform it.
But if it is the second case, one thing is certain: the HTTP API is specially developed for xObserve, so the question is: what format should I return if I want to develop a native data query API for xObserve?
Implement native data query API for xObserve
First of all, the format of the result returned by the HTTP API must be consistent with the element format in the final data format list.
Let’s use NodeGraph as an example, suppose the final data format we see in Panel Debug -> Panel Data is as below:
[
  {
    "nodes": [
      {
        "id": "frontend",
        "label": "frontend",
        "data": {
          "success": 0
        },
      },
      {
        "id": "route",
        "label": "route",
        "data": {
          "success": 70
        },
      },
    ],
    "edges": [
      {
        "source": "customer",
        "target": "mysql",
        "label": "7",
        "data": {
          "success": 7
        },
      },
      {
        "source": "frontend",
        "target": "customer",
        "label": "7",
        "data": {
          "success": 7
        },
      }
    ]
  }
]
Then result format returned by HTTP API should be consistent with the element format in the list above:
{
  "nodes": [
    {
      "id": "frontend",
      "label": "frontend",
      "data": {
        "success": 0
      },
    },
    {
      "id": "route",
      "label": "route",
      "data": {
        "success": 70
      },
    },
  ],
  "edges": [
    {
      "source": "customer",
      "target": "mysql",
      "label": "7",
      "data": {
        "success": 7
      },
    },
    {
      "source": "frontend",
      "target": "customer",
      "label": "7",
      "data": {
        "success": 7
      },
    }
  ]
}
The above JSON is the result format return by HTTP API, but this is not enough, we should wrap the data with some fields to make the return result more resonable:
{
    "status": "success",
    "error": "error message",
    "data": {
      "nodes": [
        {
          "id": "frontend",
          "label": "frontend",
          "data": {
            "success": 0
          },
        },
        {
          "id": "route",
          "label": "route",
          "data": {
            "success": 70
          },
        },
      ],
      "edges": [
        {
          "source": "customer",
          "target": "mysql",
          "label": "7",
          "data": {
            "success": 7
          },
        },
        {
          "source": "frontend",
          "target": "customer",
          "label": "7",
          "data": {
            "success": 7
          },
        }
      ]
    }
}
You can see, the data field in the above JSON is an element of the required final data format list by NodeGraph panel.
Qustion
Here is a question for our readers: If the final data format is as below:
[
  [
    {
      "id": 65,
      "name": "{\"__name__\"=\"go_goroutines\",\"instance\"=\"localhost:9090\",\"job\"=\"prometheus\"}",
      "length": 21,
      "fields": [
        {
          "name": "Time",
          "type": "time",
          "values": [
            1692950385,
            1692950400,
            1692950415,
          ]
        },
        {
          "name": "Value",
          "type": "number",
          "values": [
            34,
            34,
            34,
          ],
          "labels": {
            "__name__": "go_goroutines",
            "instance": "localhost:9090",
            "job": "prometheus"
          }
        }
      ],
      "rawName": "{\"__name__\"=\"go_goroutines\",\"instance\"=\"localhost:9090\",\"job\"=\"prometheus\"}",
      "color": "#73BF69"
    },
    {
      "id": 65,
      "name": "{\"__name__\"=\"go_goroutines\",\"instance\"=\"localhost:9100\",\"job\"=\"node\"}",
      "length": 21,
      "fields": [
        {
          "name": "Time",
          "type": "time",
          "values": [
            1692950385,
            1692950400,
            1692950415,
          ]
        },
        {
          "name": "Value",
          "type": "number",
          "values": [
            7,
            7,
            7,
          ],
          "labels": {
            "__name__": "go_goroutines",
            "instance": "localhost:9100",
            "job": "node"
          }
        }
      ],
      "rawName": "{\"__name__\"=\"go_goroutines\",\"instance\"=\"localhost:9100\",\"job\"=\"node\"}",
      "color": "#FADE2A"
    }
  ]
]
Then 1. How many queries are there in the panel? 2. Which format should the HTTP API returns?
Answer
As we can see, there are only one element in the final data format list, so the answer for question 1 is: there is only one query in the panel.
The result format returned by HTTP API should be as below:
{
    "status": "success",
    "error": "error message",
    "data": [
      {
        "id": 65,
        "name": "{\"__name__\"=\"go_goroutines\",\"instance\"=\"localhost:9090\",\"job\"=\"prometheus\"}",
        "length": 21,
        "fields": [
          {
            "name": "Time",
            "type": "time",
            "values": [
              1692950385,
              1692950400,
              1692950415,
            ]
          },
          {
            "name": "Value",
            "type": "number",
            "values": [
              34,
              34,
              34,
            ],
            "labels": {
              "__name__": "go_goroutines",
              "instance": "localhost:9090",
              "job": "prometheus"
            }
          }
        ],
        "rawName": "{\"__name__\"=\"go_goroutines\",\"instance\"=\"localhost:9090\",\"job\"=\"prometheus\"}",
        "color": "#73BF69"
      },
      {
        "id": 65,
        "name": "{\"__name__\"=\"go_goroutines\",\"instance\"=\"localhost:9100\",\"job\"=\"node\"}",
        "length": 21,
        "fields": [
          {
            "name": "Time",
            "type": "time",
            "values": [
              1692950385,
              1692950400,
              1692950415,
            ]
          },
          {
            "name": "Value",
            "type": "number",
            "values": [
              7,
              7,
              7,
            ],
            "labels": {
              "__name__": "go_goroutines",
              "instance": "localhost:9100",
              "job": "node"
            }
          }
        ],
        "rawName": "{\"__name__\"=\"go_goroutines\",\"instance\"=\"localhost:9100\",\"job\"=\"node\"}",
        "color": "#FADE2A"
      }
    ]
}
